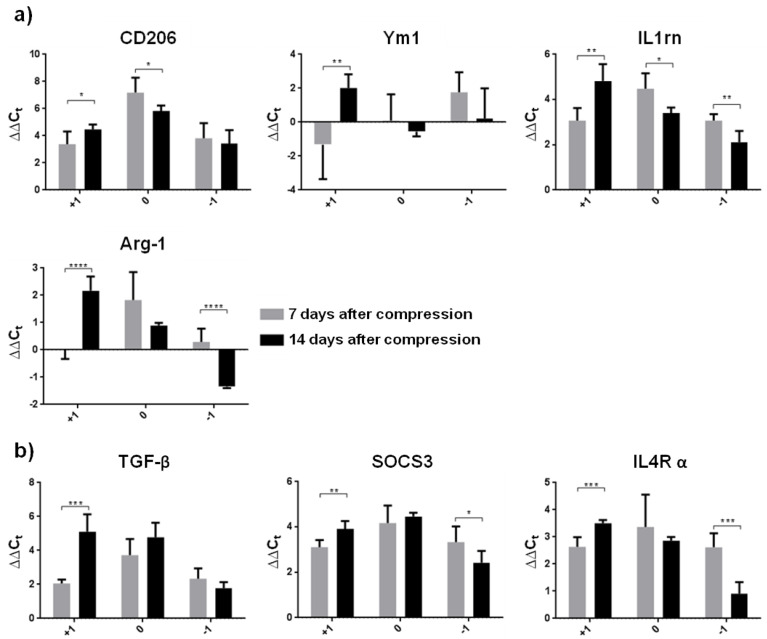
Figure 4.
Graphs demonstrating relative gene expression of neuroprotective microglia in the spinal cord (injury site, cranially and caudally) one and two weeks after Th9 compression. (a) M2a subtype of activated microglia represented by CD206, Ym1, IL1rn and Arg-1; (b) M2c subtype of activated microglia markers (TGF-β, SOCS3 and IL4R α). Data are mean values of five experiments ±SD. The mRNA levels for each marker were normalized to the mRNA levels of 18sRNA and expressed as ∆∆Ct values relative to controls. Results were statistically evaluated using unpaired t-test; * p ˂ 0.05; ** p ˂ 0.01; *** p ˂ 0.001; **** p ˂ 0.0001. CD206—mannose receptor and C-type lectin; Ym1—chitinase-like protein-1; IL1rn—interleukin 1 receptor antagonist; Arg-1—arginase-1; TGF-β—transforming growth factor beta; SOCS3—suppressor of cytokine signaling 3; IL4R α—interleukin 4 receptor alpha.

