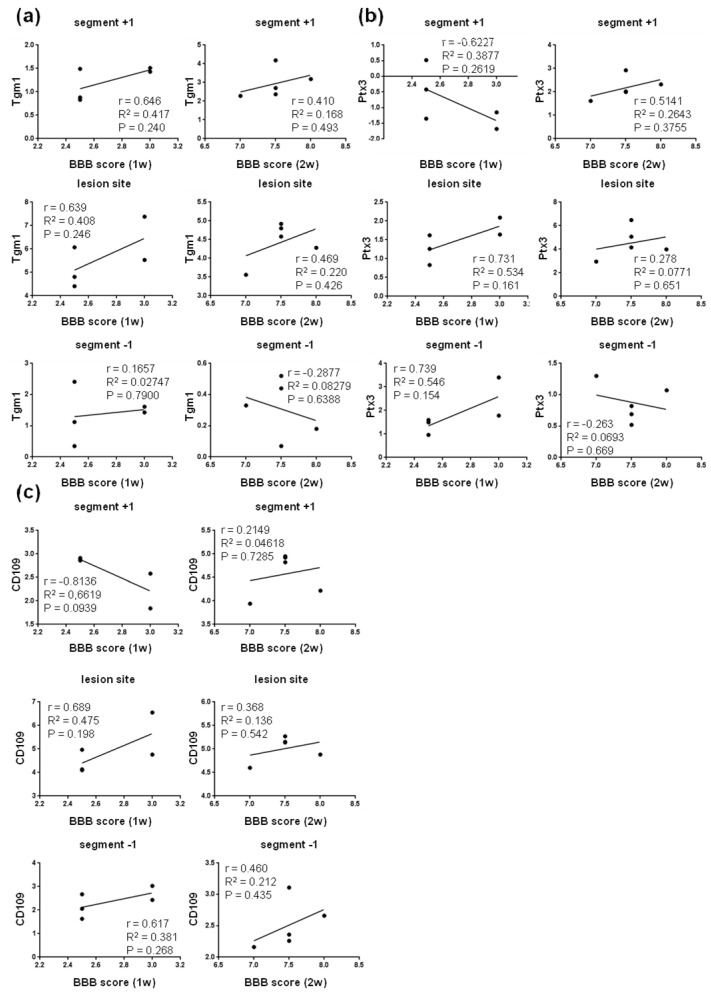
Figure 11.
Correlation analysis of relative gene expression of neuroprotective A2 astrocyte markers Tgm1 (a), Ptx3 (b) and CD109 (c) in the cranio–caudal extent of the spinal cord versus BBB neurological scores at one and two weeks post-SCI. Scatterplots of individual values (n = 5) with regression line correlation coefficient (r), coefficients of determination (r2) calculated using regression analysis and p-value. SCI—spinal cord injury; Tgm1—Transglutaminase 1; Ptx3—Pentraxin 3; CD109—Cluster of differentiation 109.

