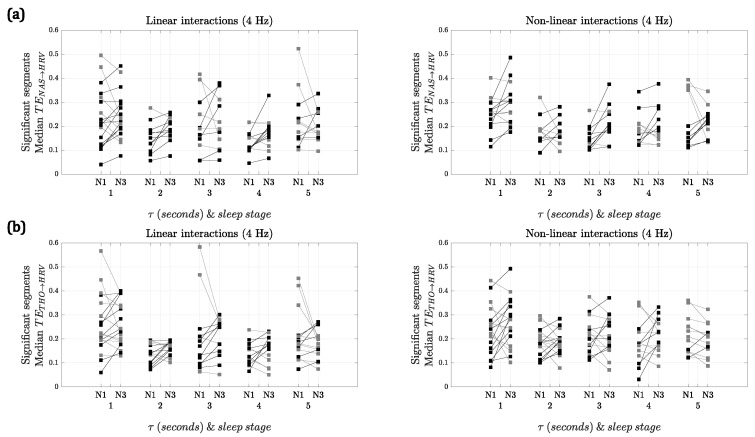
Figure 3.
Median of significant segments for each kind of interaction at 4 Hz vs. lag () in seconds. (a) ; (b) . Gray lines represent higher interactions in NREM1, while black lines correspond to higher interactions in NREM3. Linear interactions are on the left, for which significant differences using are found at and s. Nonlinear interactions are on the right, for which significant differences using are found at and s. No significant differences are found using .

