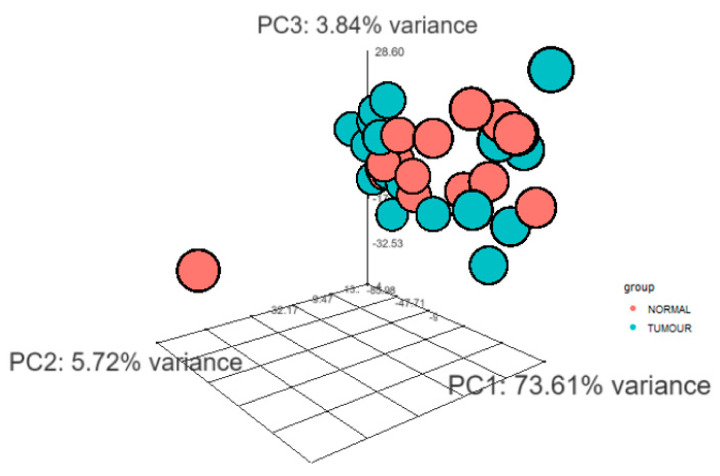
Figure 2.
3D Principal component analysis (PCA) clustered transcript expression profiling of tumour and normal samples. 3D-PCA plot highlights the 3 principal components (PC1, PC2 and PC3). The groups have been marked by different colour; blue: tumour, orange: normal. The figure highlights that the tumour and normal samples were clustered separately.

