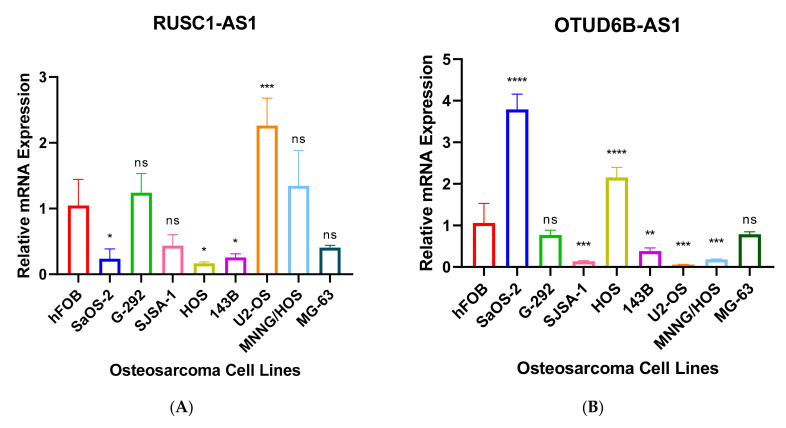
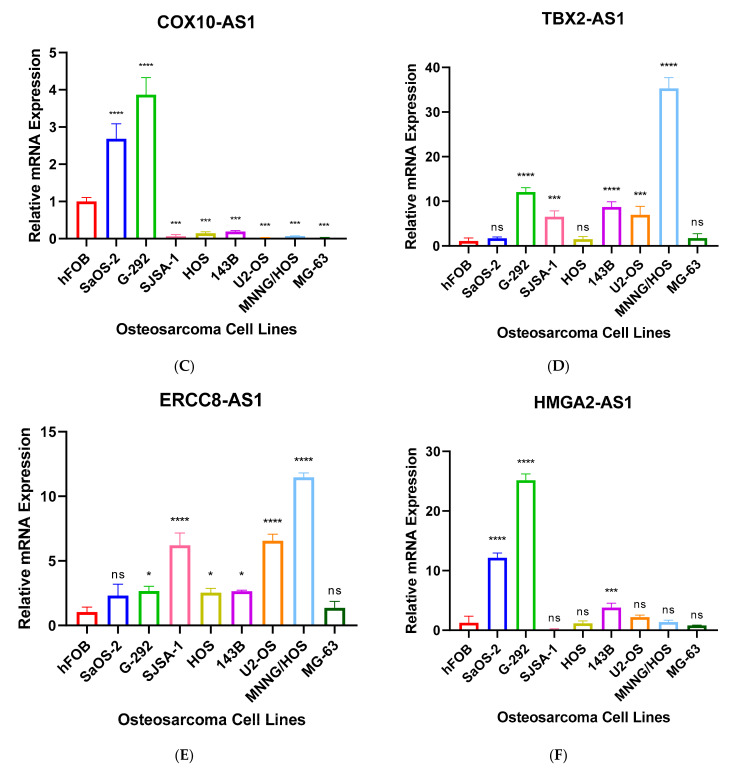
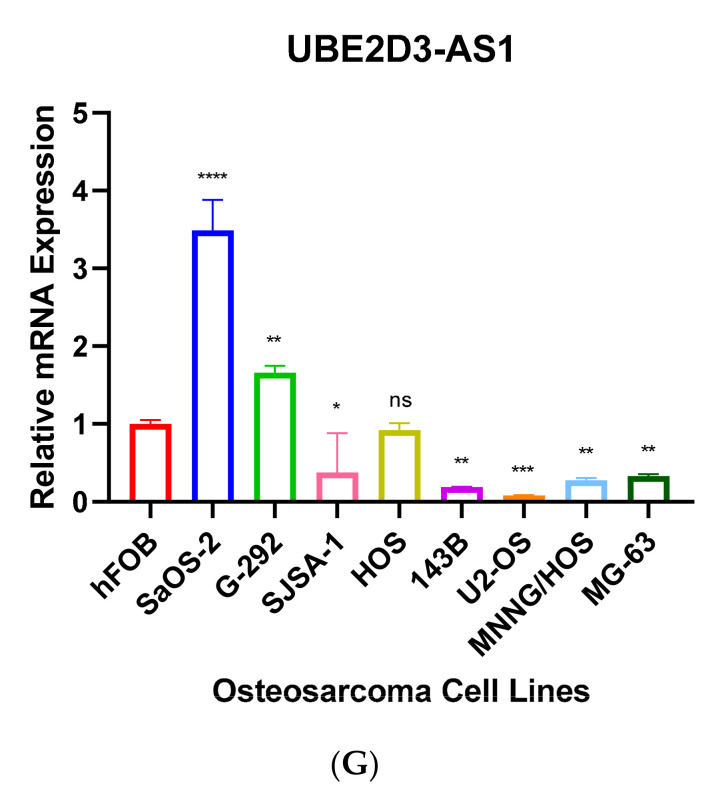
Figure 5.
(A–G). RT-qPCR analysis of antisense lncRNAs. The transcripts expressions were determined using 8 different osteosarcoma cell line; SaOS-2, G-292, SJSA-1, HOS, 143B, U2-OS, MNNG/HOS, MG-63 and relative lncRNA expression obtained by hFOB expression. * p < 0.05, ** p < 0.01, *** p < 0.001, **** p < 0.0001.


