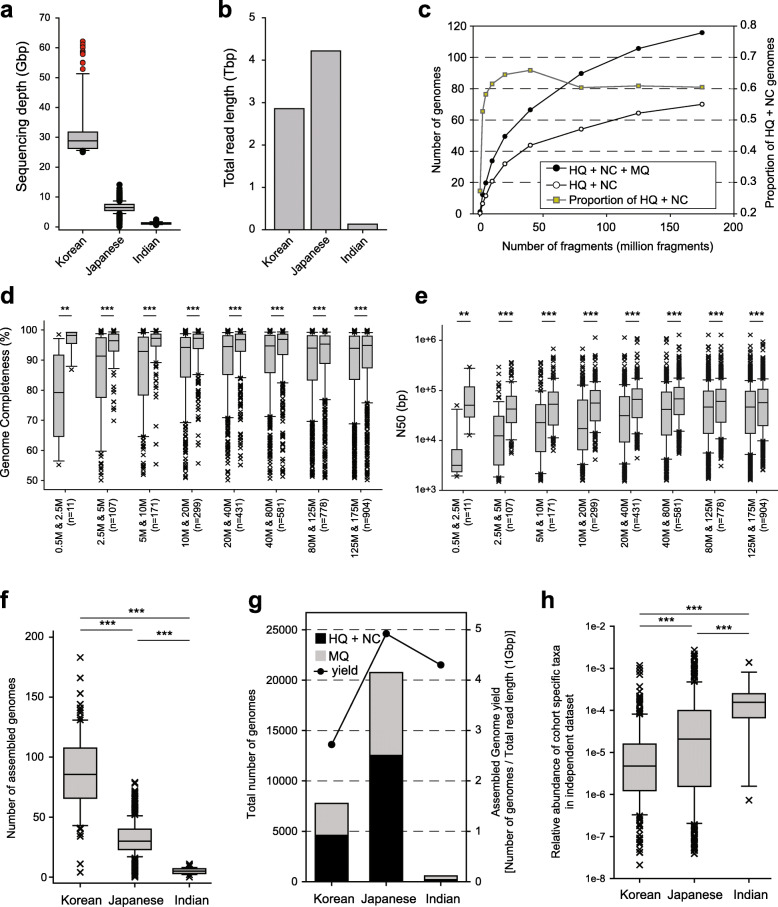
Fig. 1.
Effect of sequencing depth on de novo genome assembly. a Sequencing depth of samples from Korea, Japan, and India. Red data points, nine samples used for the generation of simulated samples for different sequencing depths. b Total read length of samples from Korea, Japan, and India. c The average number of genomes (left axis) and the proportion of (HQ + NC) genomes (right axis) from nine samples. d, e Completeness (d) and N50 (e) of assembled genomes from lower sequencing depth (left box of each column) and greater sequencing depth (right box of each column). f The number of the assembled genomes from Korea, Japan, and India. g Total number of the assembled genomes from Korea, Japan, and India, and genome assembly yields. h The relative abundance of 224 Korea-specific, 338 Japan-specific, and 18 India-specific assembled genomes in independent fecal samples from the USA (n = 926). P values were calculated by two-sided Mann–Whitney U test (**: P < 0.01; ***: P < 0.001).

