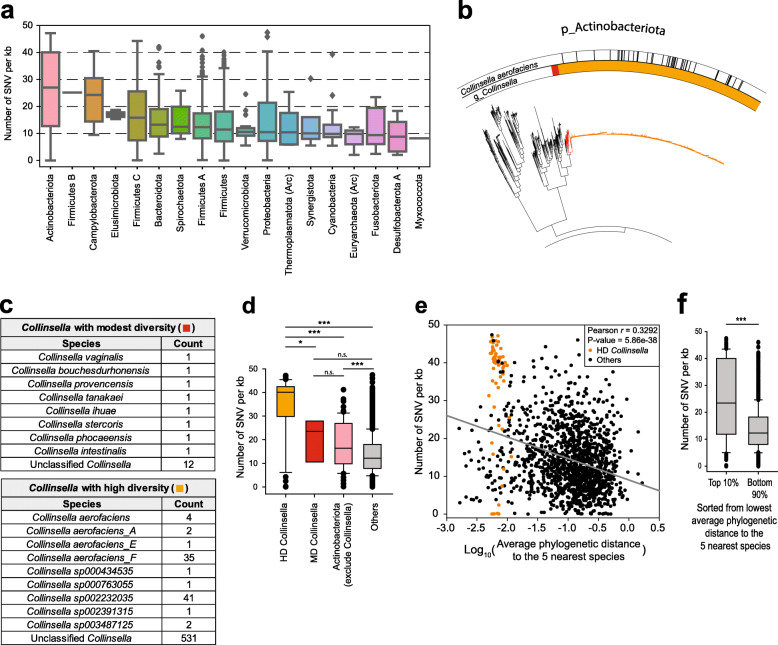
Fig. 3.
SNV density analysis of the relationship between within-species variation and speciation of gut microbes. a The number of SNVs per kb pair of the aligned region. SNV density is summarized for each phylum. Boxes are sorted by the median. Arc, archaeal phylum. b The phylogenetic tree for Actimobacteriota phylum. Inside annotation indicates the Collinsella genus, divided into Collinsella with modest phylogenetic dispersion (MD Collinsella, Red) and Collinsella with high phylogenetic dispersion (HD Collinsella, Orange). Black annotations in the outer circle represent Collinsella aerofaciens, Collinsella aerofaciens_A, Collinsella aerofaciens_E, and Collinsella aerofaciens_F, according to the GTDB-TK annotation. c GTDB-TK based taxonomic annotation of MD Collinsella and HD Collinsella. d SNV density of HD Collinsella, MD Collinsella, Non-collinsella actinobacteriota, and other species. e Scatter plot analysis of SNV density of 1521 representative species with ≥ 10 subspecies genomes in the cluster and their average phylogenetic distance to the five nearest species of each representative species. Orange points denote species of HD Collinsella and black points represent other species. f Comparison of SNV density between the top 10% and bottom 90% of the 1521 species sorted from the lowest average phylogenetic distance to the five nearest species. Statistical significance was calculated by two-sided Mann–Whitney U test (n.s.: not significant; *: P < 0.05; ***: P < 0.001)

