Fig. 6.
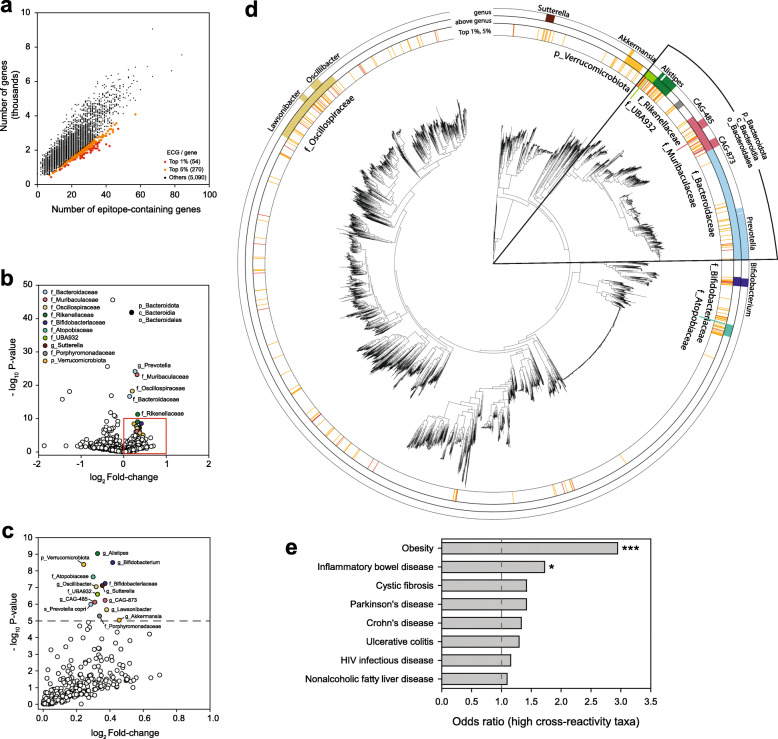
Analysis of cross-reactivity potential of gut bacterial taxa. a The number of genes and autoimmune epitope-containing genes (ECGs) in 5414 genomes of species representatives. Red and orange points, species with the top 1% and 5% ECG per gene, respectively. b Volcano plot of the enrichment of ECG density. Taxonomic clades with positive log2 fold-change and P < 1e−5 are highlighted with different colors. Taxonomic clades denoted by the same color have an inclusive relationship (e.g., g_Prevotella belongs to f_Bacteroidaceae), with the exception of p_Bacteroidota, c_Bacteroidia, and o_Bacteroidales. The first character of each clade name indicates the taxonomic levels (p: phylum; c: class; o: order; f: family; and g: genus). c The red-highlighted area from b. d Maximum-likelihood phylogenetic tree with taxonomic annotations of clades with high ECG density. The first layer represents clades with the top 1% (red) and 5% (orange) ECG density [annotations and color designations are the same as in a]. The second and third layers represent enriched taxonomic clades in the volcano plot [taxonomic annotations and color designations are the same as in b and c]. The second layer represents above-genus-level annotations. The third layer represents genus-level taxonomic clades. e Odds ratio (odds that high cross-reactivity taxa are associated with the disease / odds that low cross-reactivity taxa are associated with the disease) for diseases with ≥ 40 annotated taxa by gutMDisorder database. Statistical significance was calculated by Fisher’s exact test (*: P < 0.05; ***: P < 0.005)

