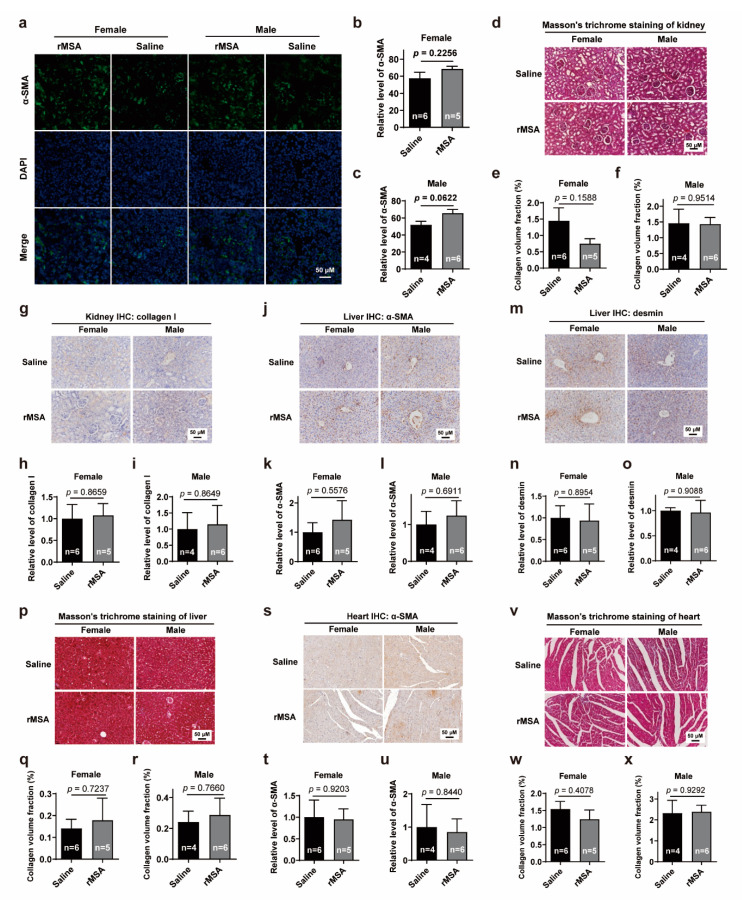
Figure 5.
Effects of rMSA injection on the fibrosis level of kidney, liver and heart (a) The representative images of α-SMA in mice kidney. Scale bar, 50 μm. (b,c) The quantitative results of α-SMA level in female (b) and male (c) mice. (d) The Masson’s trichrome staining of mice kidney. Scale bar, 50 μm. (e,f) The collagen volume fraction of the kidney in female (e) and male (f) mice. (g) The immunohistochemical staining for collagen I in mice kidney. Scale bar, 50 μm. (h,i) The relative level of collagen I in female (h) and male (i) mice. (j) The immunohistochemical staining for α-SMA in mice liver. Scale bar, 50 μm. (k,l) The relative level of α-SMA in female (k) and male (l) mice. (m) The immunohistochemical staining for desmin in mice liver. Scale bar, 50 μm. (n,o) The relative level of desmin in female (n) and male (o) mice. (p) The Masson’s trichrome staining of mice liver. Scale bar, 50 μm. (q,r) The collagen volume fraction of the liver in female (q) and male (r) mice. (s) The immunohistochemical staining for α-SMA in mice heart. Scale bar, 50 μm. (t,u) The relative level of α-SMA in female (t) and male (u) mice. (v) The Masson’s trichrome staining of mice cardiac muscle. Scale bar, 50 μm. (w,x) The collagen volume fraction of the cardiac muscle in female (w) and male (x) mice. All graphs represent mean with SEM, with p values calculated by the two-tail t test. n, number of mice used for each analysis.

