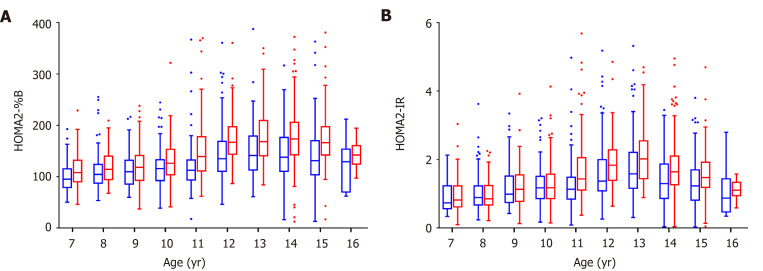
Figure 1.
Islet function traits of children and adolescents in the control population by sex. A: Beta-cell function; B: Insulin resistance. The box plots show the median (horizontal line), interquartile range (box), 5th percentiles (whiskers), 95th percentiles (whiskers), and outliers outside the 5th and 95th percentiles (dots). Red boxes represent female control population and blue boxes represent male control population. HOMA2-%B: Homeostasis model assessment of β-cell function; HOMA2-IR: Homeostasis model assessment of insulin resistance.

