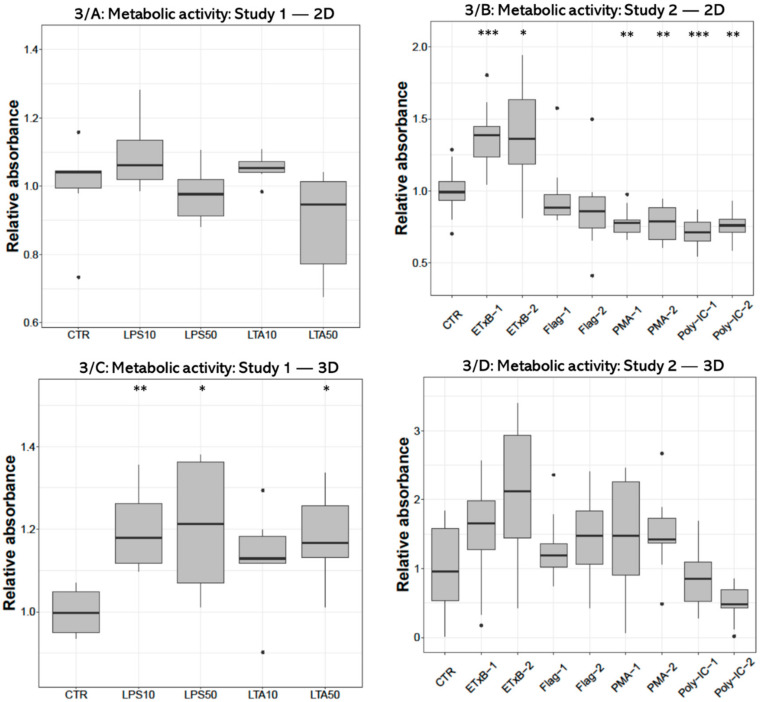
Figure 3.
Boxplots showing the metabolic activity of hepatocyte—non-parenchymal cells in 2D (Study 1: (A) and Study 2: (B)) and 3D (Study 1: (C) and Study 2: (D)) co-cultures indicated by the CCK-8 assay (nstudy 1 = 6/group, nstudy 2 = 10/group). Relative absorbances were calculated by considering the mean value of control cultures as 1. The “CTR” refers to control cells that received none of the treatments. The treatments were: LPS10 and LPS50 = 10 and 50 µg/mL lipopolysaccharide (LPS) from Escherichia coli, LTA10 and LTA50 = 10 and 50 µg/mL lipoteichoic acid (LTA) from Staphylococcus aureus, ETxB-1 and -2 = 20 and 50 µg/mL subunit B of heat-labile enterotoxin of Escherichia coli, Flag-1 and -2 = 100 and 250 ng/mL flagellin from Salmonella Typhimurium, PMA-1 and -2 = 100 and 1000 ng/mL phorbol myristate acetate (PMA), poly-IC-1 and -2 = 50 and 100 µg/mL polyinosinic polycytidylic acid (poly I:C). Asterisks over the boxes refer to significant differences compared to “CTR” cells within the same cell culture model and the same study. * p < 0.05, ** p < 0.01, *** p < 0.001.

