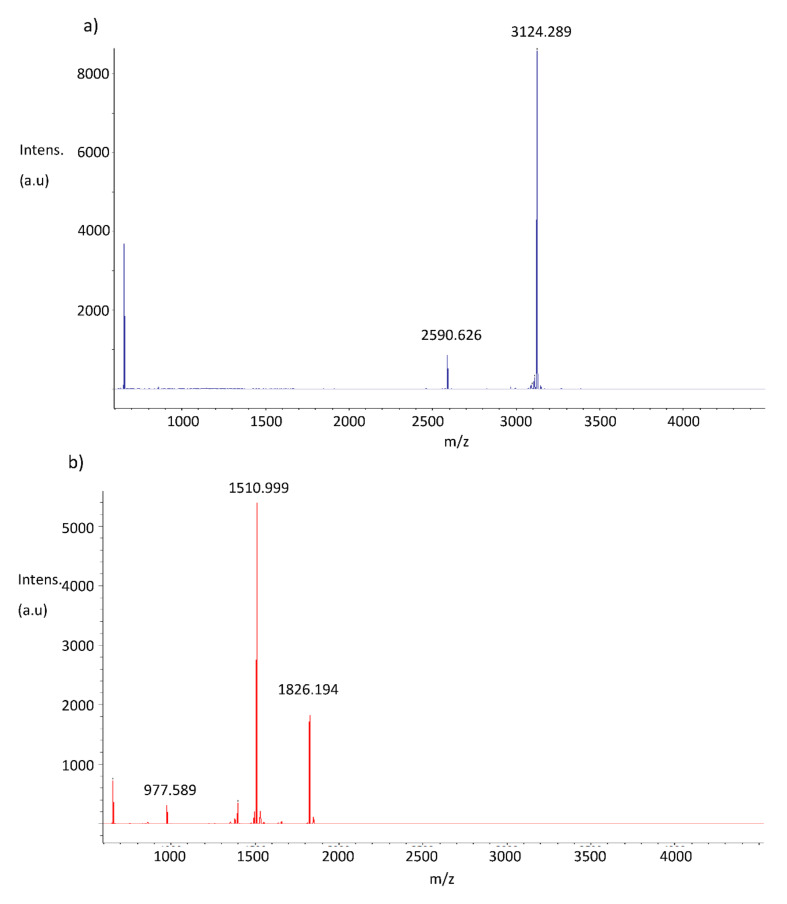
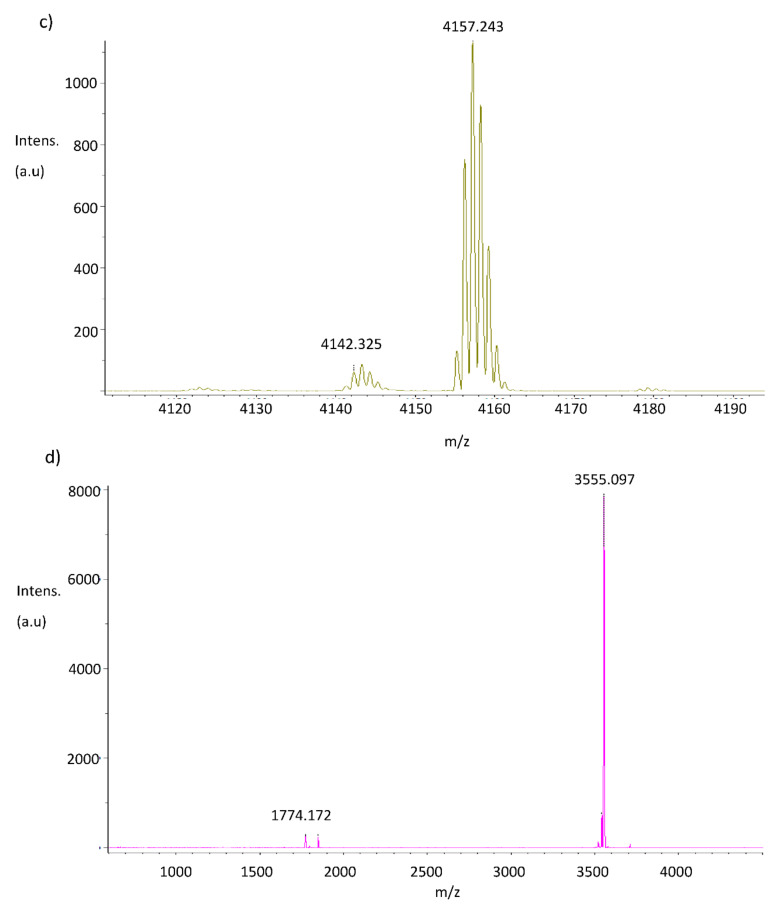
Figure 5.
Mass spectrometry profiles of NE-incubated peptides. Mass spectrometry profiles of (a,b) Sn1b, (c,d) SnE1 and SnV1 (e,f) following incubation in the presence (b,d,f) or absence (a,c,e) of NE for 4 h. The relative intensity of the ions (arbitrary units, au) is shown on the y-axis, and the mass to charge ratio (m/z), corresponding to the molecular masses (Daltons) are shown on the x-axis.


