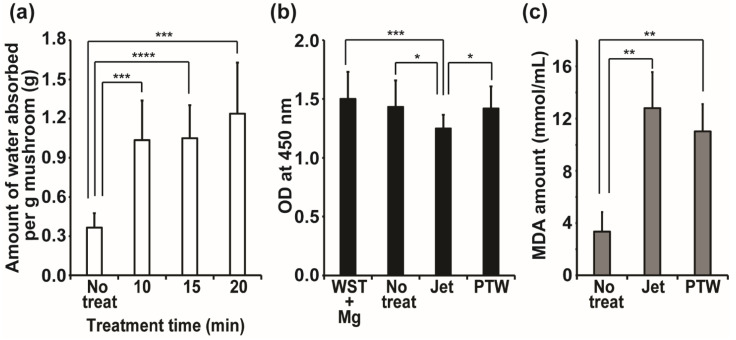
Figure 6.
Hydrophilicity (a), redox potential (b), and lipid peroxidation of bacteria (c) on the surfaces of mushrooms. Values were the average of 12, 19, and 6 measurements in (a), (b), and (c), respectively. Only significantly different groups were indicated; * p < 0.05, ** p < 0.01, *** p < 0.001, **** p < 0.0001.

