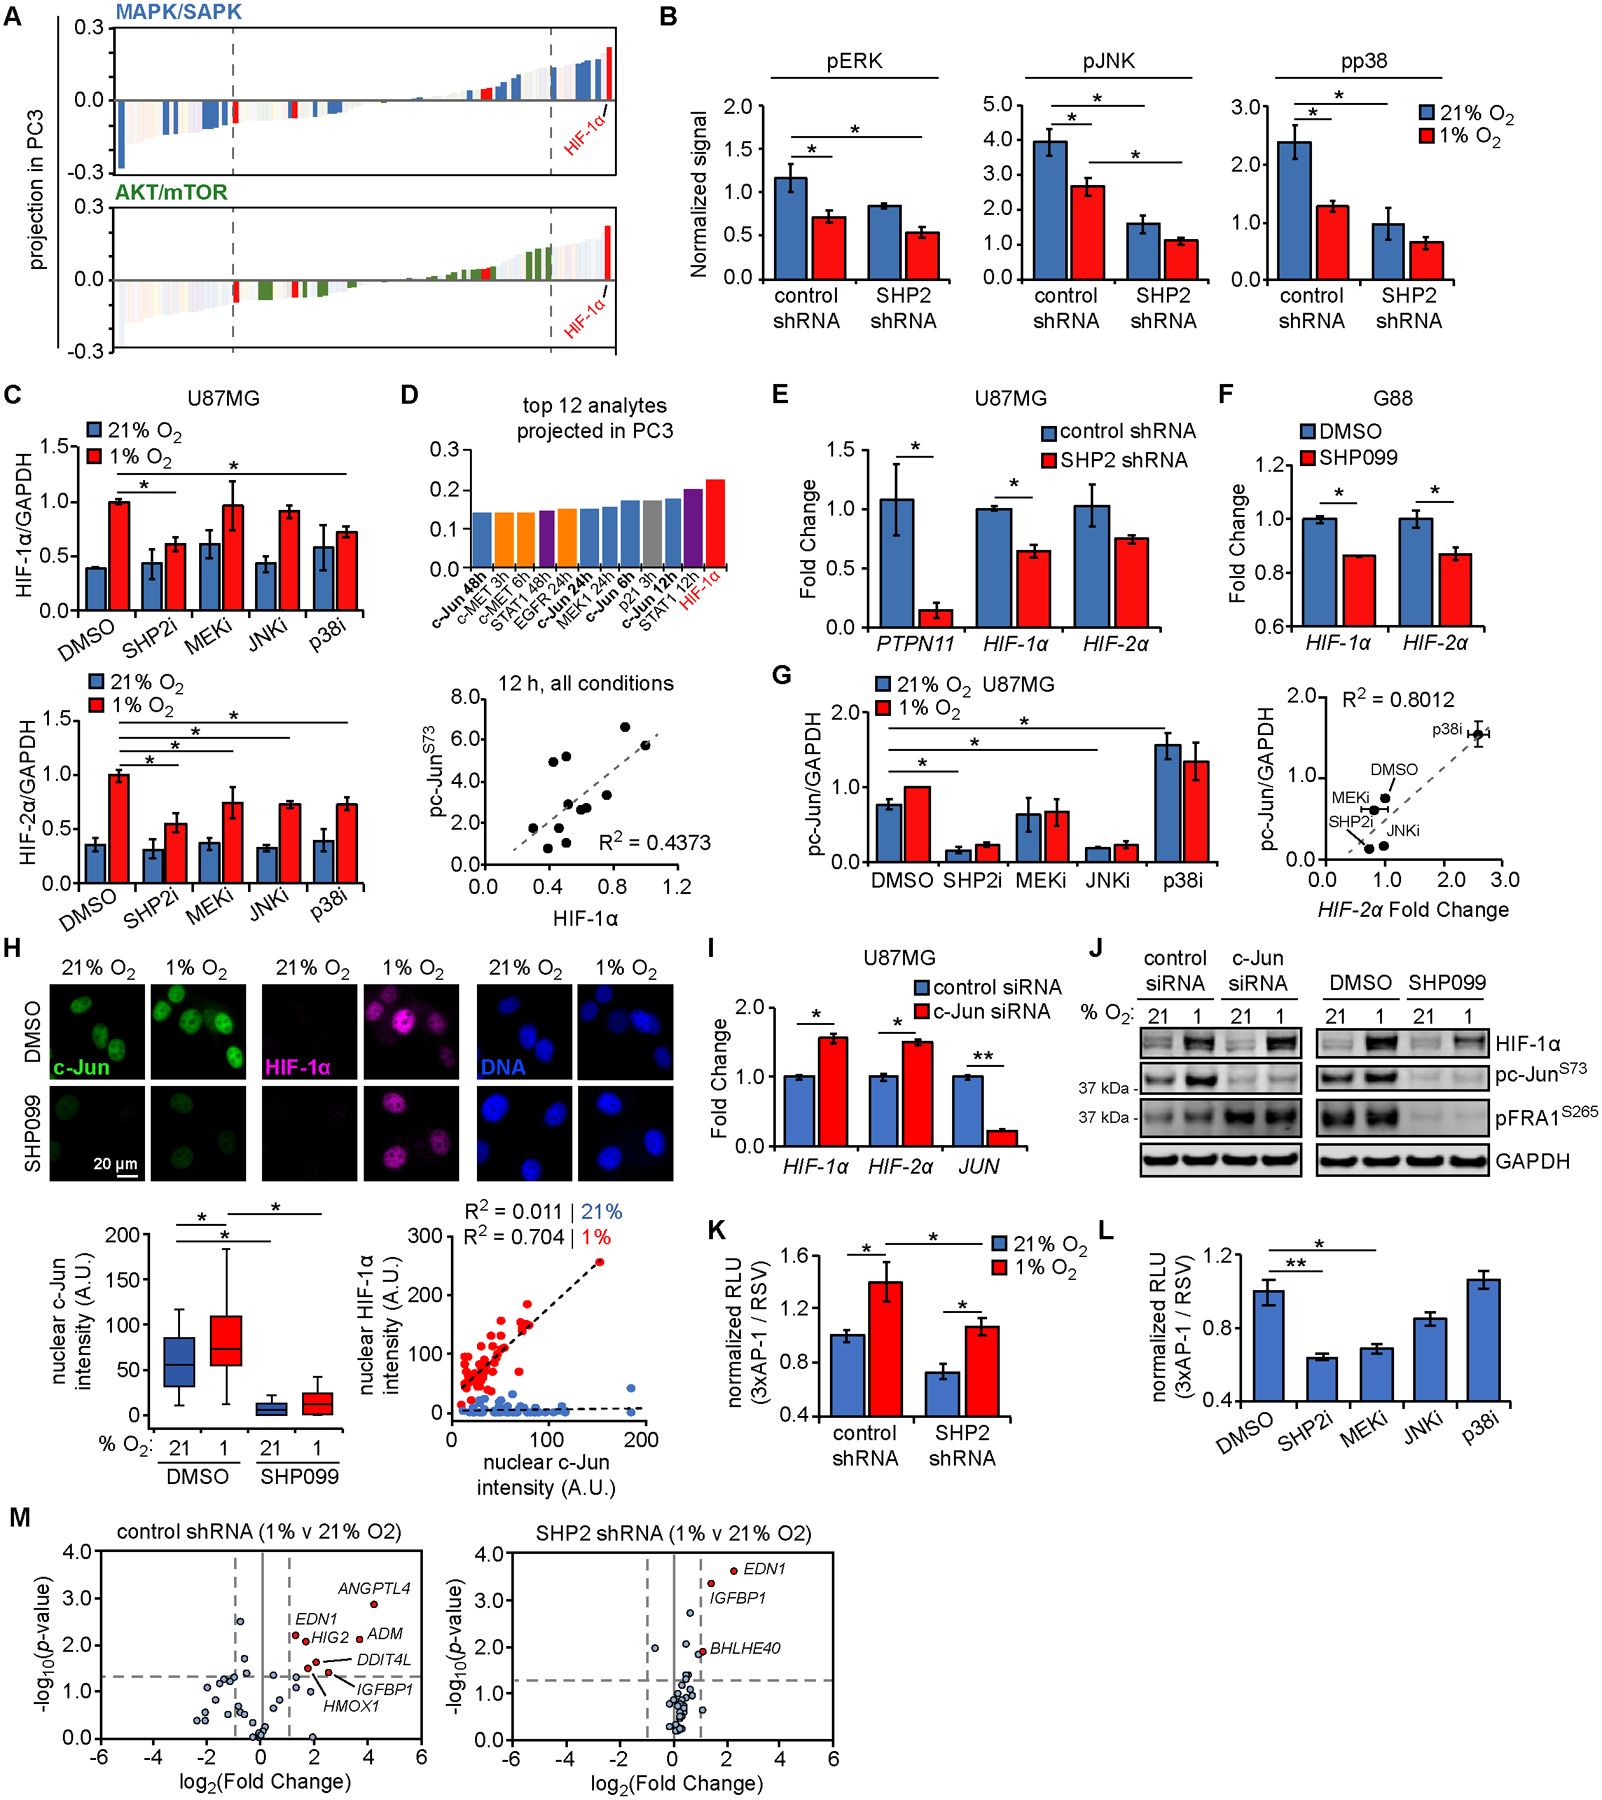
Figure 4. SHP2 antagonism impairs HIF expression via decreased, MAPK-dependent AP-1 transcriptional activity.

(A) Projection of signals and phenotypes (smallest to largest) in principal component 3 (PC3) with highlighted signals from MAPK/SAPK and AKT/mTOR Luminex kits. Dashed lines indicate highly negatively or positively projected analytes. (B) Luminex signals (normalized to control shRNA at 0 h) for DMSO treatment in 21% or 1% oxygen, for phosphorylated ERK (T185/Y187; 48 h), JNK (T183/Y185; 48 h), and p38 (T180/Y182; 48 h). (C) U87MG cells were pre-treated for 24 h with 10 μM SHP099 (SHP2i), 5 μM CI-1040 (MEKi), 20 μM SP600125 (JNKi), 20 μM SB203580 (p38i), or DMSO, followed by exposure to 21% or 1% oxygen for 6 h. Lysates were analyzed by western blotting, with densitometry for normalized HIF-1α and HIF-2α. Representative blot images in Fig. S4H. (D) The 12 signals or phenotypes with largest positive projection in PC3 are shown, with c-Jun loadings highlighted (bold). Normalized phosphorylated c-Jun (S73) Luminex values are plotted versus HIF-1α expression at 12 h, across all conditions. (E) RNA was extracted from U87MG cells expressing control or SHP2 shRNA. qRT-PCR was performed using primers against indicated transcripts; PTPN11 = SHP2 gene symbol. (F) G88 cells were treated for 48 h with 10 μM SHP099 or DMSO, and RNA was extracted. qRT-PCR was performed using primers for indicated transcripts. (G) Quantification of phosphorylated c-Jun for blots described in (C). U87MG cells similarly pre-treated with MAPK inhibitors in 21% oxygen were lysed and RNA extracted. qRT-PCR was performed using primers for HIF-2α. Fold changes shown in Fig. S4L. Normalized pc-Jun signals are plotted versus HIF-2α fold changes, across treatments with MAPK inhibitors in 21% oxygen. (H) U87MG cells were pre-treated for 24 h with 10 μM SHP099 or DMSO, followed by exposure to 21% or 1% oxygen for 6 h. Cells were stained for c-Jun, HIF-1α, and DNA. Scale bar = 20 μm. Nuclear c-Jun and HIF-1α intensities were quantified for n > 100 cells across three biological replicates. Scatter plots for cells in 21% (blue) or 1% oxygen (red) were also created. (I) U87MG cells were transfected with control or c-Jun siRNA for 48 h. qRT-PCR was performed using extracted RNA and primers for indicated transcripts. (J) Cells transfected in parallel were exposed to 21% or 1% oxygen for 6 h. Lysates were analyzed by western blotting using antibodies against indicated proteins. Lysates from cells treated with SHP099 or DMSO, as described in (C), were re-blotted using antibodies against indicated proteins. (K) U87MG cells expressing control or SHP2 shRNA were transfected with plasmids encoding AP-1- or Rous sarcoma virus (RSV)-regulated luciferase expression, followed by 21% or 1% oxygen exposure for 6 h, addition of D-luciferin, and bioluminescence measurement. (L) U87MG cells transfected as in (K) were treated for 24 h with 10 μM SHP099 (SHP2i), 5 μM CI-1040 (MEKi), 20 μM SP600125 (JNKi), 20 μM SB203580 (p38i), or DMSO, prior to D-luciferin addition and bioluminescence measurement. (M) U87MG cells expressing control or SHP2 shRNA were exposed to 21% or 1% oxygen for 72 h, and hypoxia-regulated transcripts were measured by qPCR array. Volcano plots comparing gene expression between 21% and 1% oxygen for control or SHP2 shRNA are shown. Red dots indicate genes with p-value and fold-change above indicated thresholds (dashed lines). Throughout the panels, representative images are shown, and error bars indicate mean ± s.e.m. for three replicates, unless otherwise indicated. For box plots, median, first/third quartiles, minimum/maximum, and outlier values are displayed for indicated cell numbers across replicates. Statistical comparisons were made by Tukey’s post-hoc testing following two-way ANOVA (panels B, C, G, K, M), Tukey’s post-hoc testing following one-way ANOVA (panels H, L), or Student’s t-test (panels E, F, I). * p < 0.05 and ** p < 0.01 for indicated comparisons.
