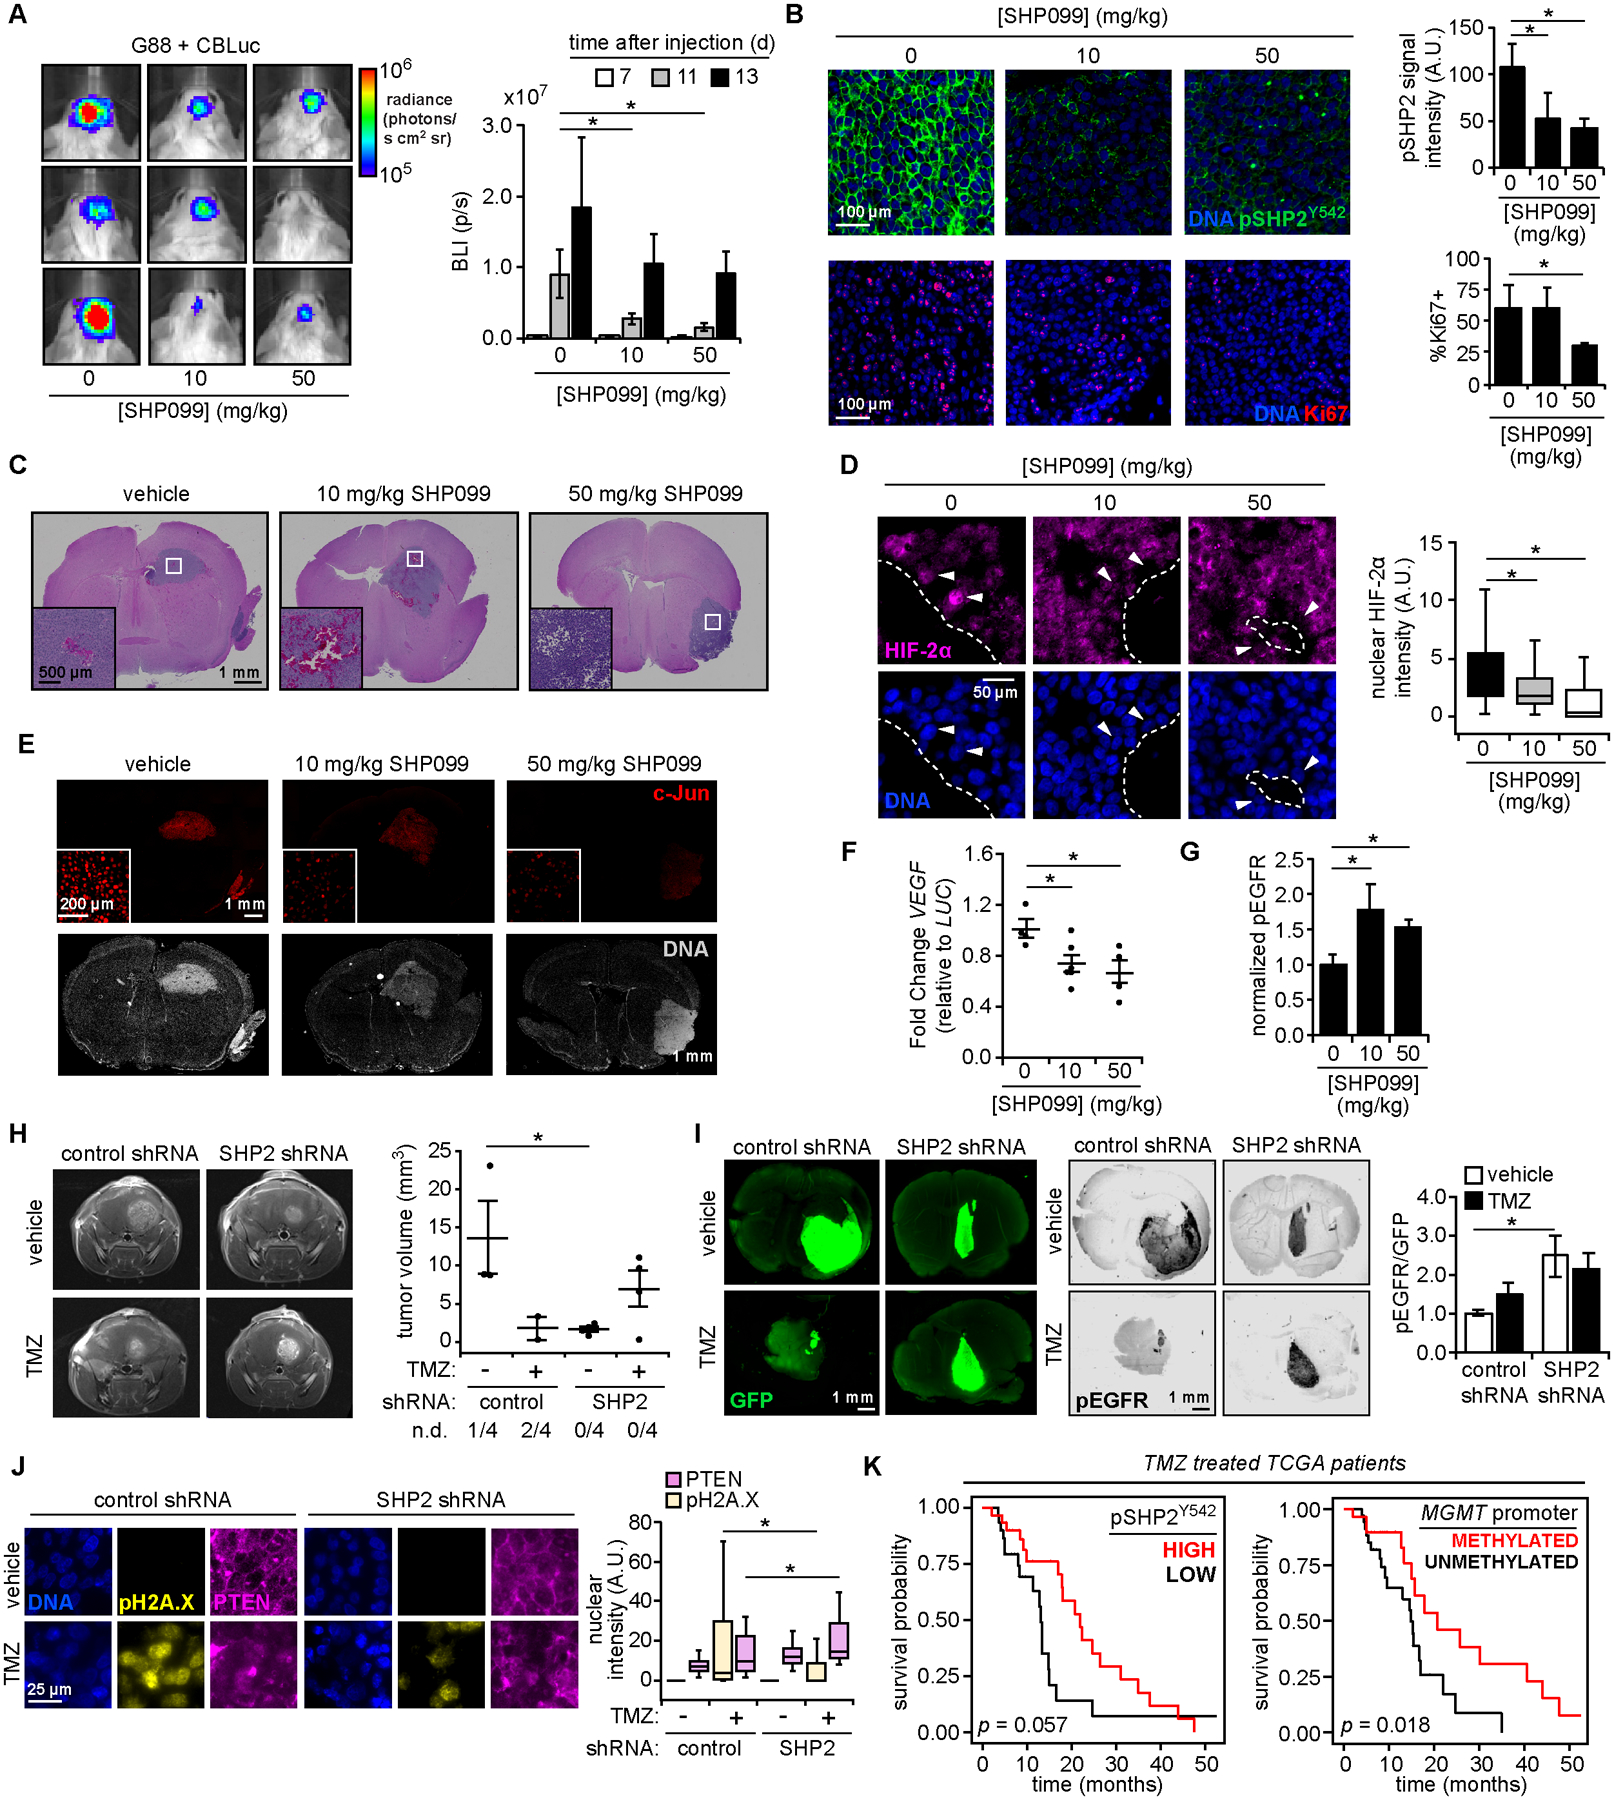
Figure 6. Model-predicted relationships are recapitulated in vivo.

(A) Orthotopic mouse xenograft tumors were generated using G88 cells expressing click beetle luciferase (CBLuc). Mice were treated SHP099 and imaged at indicated times (n = 5 for vehicle and 50 mg/kg SHP099; n = 6 for 10 mg/kg SHP099; see Fig. S6A for timeline). Representative images 11 days (d) after injection are shown, with bioluminescence (photons per second, p/s) plotted for all times. (B) Tumor sections were stained for indicated proteins and DNA. Scale bar = 100 μm. pSHP2 Y542 signal quantification was performed for >3 fields-of-view per tumor. Ki67 positivity was determined for n >1000 cells per tumor. (C) Hematoxylin and eosin stained tumors for mice treated as in (A). Scale bar = 1 mm. White boxes highlight features resembling hypoxic GBM tumors, enlarged as inset. Scale bar = 500 μm. (D) Tumor sections from SHP099-treated mice were stained for HIF-2α and DNA. Nuclear HIF-2α intensities for n >150 cells, across three tumors per group, that neighbor low oxygen regions, as identified in (C), are plotted. Arrows highlight nuclei adjacent to void regions with differences in nuclear HIF-2α. Boundaries between these regions and tumor indicated by dashed line. Scale bar = 50 μm. (E) For tumors described in (C), sections were stained for c-Jun and DNA. Scale bar = 1 mm, inset scale bar = 200 μm. (F) Using tumor-extracted RNA, qRT-PCR was performed with primers for indicated transcripts (n = 4 for vehicle and 50 mg/kg SHP099; n = 5 for 10 mg/kg SHP099). (G) Tumor sections stained with antibodies against pEGFR Y1068 or human COXIV, plus Alexa Fluor 647 secondary antibodies, were imaged on an infrared scanner with densitometry performed. Normalized pEGFR values are shown (n = 3 per group), with representative sections in Fig. S6D. (H) 13 days after orthotopic injection of G88 cells expressing control or SHP2 shRNA, and treatment with 15 mg/kg temozolomide (TMZ) or vehicle as described in Fig. S6E (n = 5 for vehicle groups, n = 6 for TMZ groups), MRI was performed (n = 4 mice per group for MRI). Tumor volumes are plotted, with number of non-detected (n.d.) tumors indicated. See Fig. S6F for complete MRI data. (I) Tumor sections from panel (H) stained with antibodies against GFP and pEGFR, plus Alexa Fluor 647 secondary antibodies, were scanned with an infrared scanner, with densitometry. Normalized pEGFR values are shown (n = 3 per group), with representative sections. (J) Tumor sections were stained for indicated proteins and DNA. Scale bar = 25 μm. Quantified nuclear pH2A.X and PTEN intensities for n >100 cells across three tumors per group are plotted. (K) TCGA data were analyzed to calculate survival probability versus time for GBM patients treated with temozolomide, classified by pSHP2 Y542 RPPA levels (stratified by patients with n = 30 highest or lowest signal) or MGMT-promoter methylation status (n = 29 methylated, n = 34 unmethylated). P-values from log-rank test for survival comparisons are shown. Throughout the panels, representative images are shown, and error bars indicate mean ± s.e.m for indicated number of replicates. For box plots, median, first/third quartiles, and minimum/maximum values are displayed for indicated cell numbers across replicates. Statistical comparisons were made by Tukey’s post-hoc testing following one-way ANOVA (panels A, B, D, F, G, J) or Tukey’s post-hoc testing following two-way ANOVA (panel H). * p < 0.05 for indicated comparisons.
