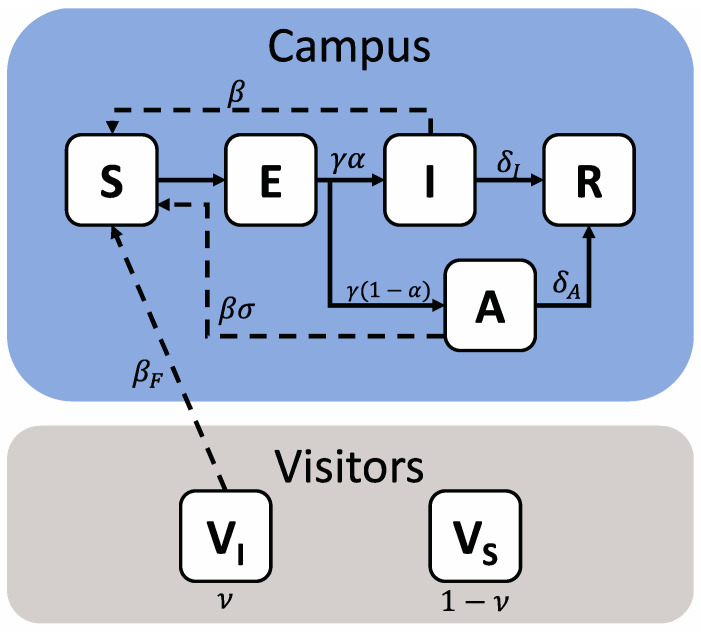
Figure 1.
Schematic representation of a model of COVID-19 transmission due to in-person sporting events. The campus population is shown within the blue field, while visitors are shown within the grey field. The campus population can take five health states—Susceptible (S), Exposed (E), Infectious (I), Asymptomatic (A) or Removed (R), while visitors are represented as two states, Susceptible (VS) or Infectious (VI). Solid arrows denote transition terms, while dashed arrows denote potential transmission pathways. The relevant parameters for each are also shown.

