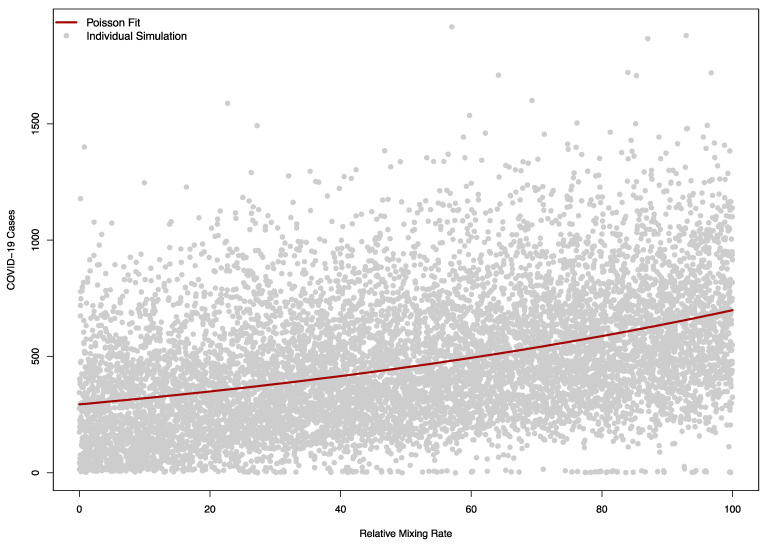
Figure 8.
Model sensitivity to the relative mixing rate between campus community and visitors in a model (). A value of zero corresponds to no mixing between the campus and visitors, while 100 corresponds to a level of mixing equal to the campus-campus mixing rate pre-COVID. The solid red line indicates a Poisson regression fit of simulated COVID-19 cases, while each grey dot corresponds to a single simulation.

