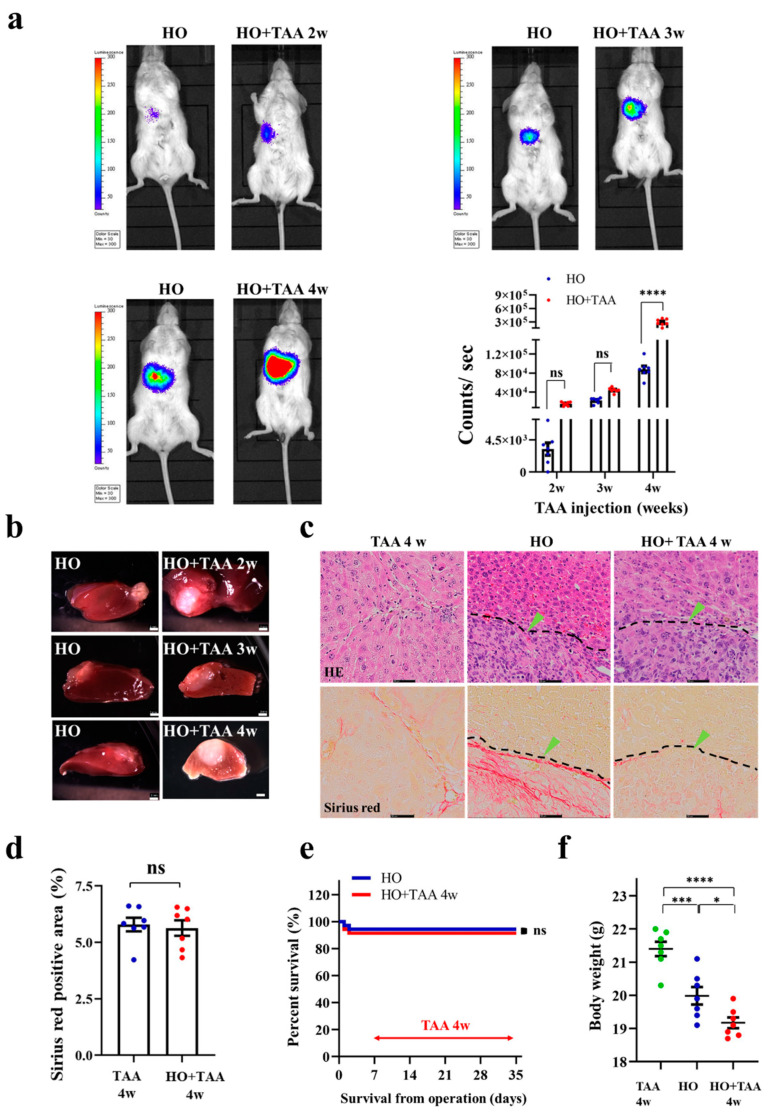
Figure 4.
Implantation of HCC organoid into the liver with fibrosis TME. (a) BLI of luciferase signal in mice with or without fibrosis TME. Left to the right column (top): implanted HCC organoid only (HO), implanted HO + TAA injection 2 weeks. Third to the fourth left panel: implanted HO only, implanted HO + TAA injection 3 weeks. Left to the right column (bottom): implanted HO only, implanted HO + TAA injection 4 weeks (implanted HO only was regarded as control group at the same time); tumor cells were illuminated as pseudo color. Two-way ANOVA test, (n = 7/group). (b) Images of implanted HO without TAA injection at a different times (left panel), and implanted HO + TAA injection 2 weeks, 3 weeks, 4 weeks (right panel); the scale bar represents 2 mm. (c) HE staining and Sirius red staining of the liver treated with TAA injection 4 weeks only, HO and HO + TAA injection 4 weeks (left to right). In the HE staining results (top), the black dotted line indicates liver tissue and tumor tissue junction. Green arrows indicate tumor cells. Scale bar represents 50 μm. (d) Measurement of the fibrosis area in TAA injection 4 weeks group and HO + TAA injection 4 weeks group was performed with Mann–Whitney U test, (n = 7/group). (e) The survival rate of HO and HO + TAA injection 4 weeks. Log-rank test (n = 14). (f) Body weight of mice. One-way ANOVA followed by Tukey’s multiple comparisons test (n = 7/group). * p < 0.05, *** p < 0.001, **** p < 0.0001; ns: not significant.

