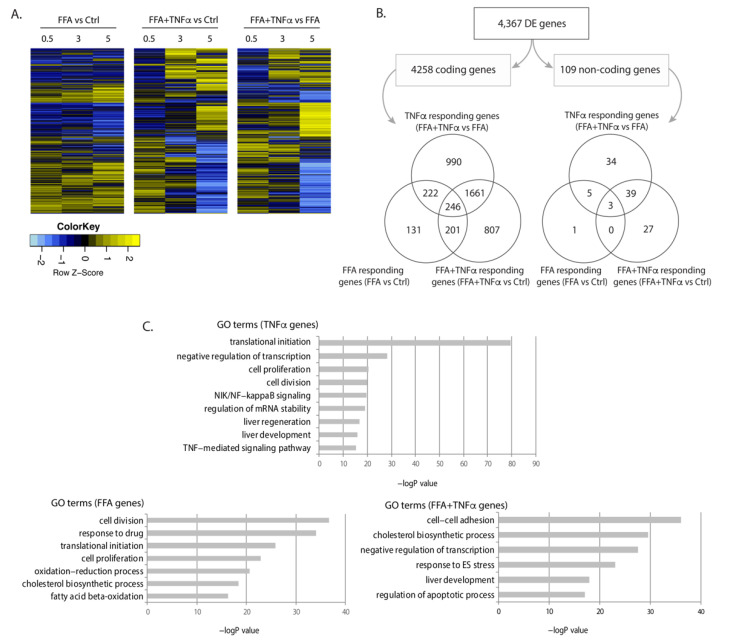
Figure 2.
Differentially expressed genes upon FFA and TNFα stimulation. (A) Heatmap of differentially expressed (DE) genes in each condition at FDR < 0.1. Fold change of gene expression Z-scores is shown. (B) Number and Venn diagrams of DE genes at FDR < 0.1 in each condition for coding (left) and non-coding genes (right). (C) Pathway analysis for DE coding genes including gene ontology (GO) terms and false discovery rate (FDR) for each condition.

