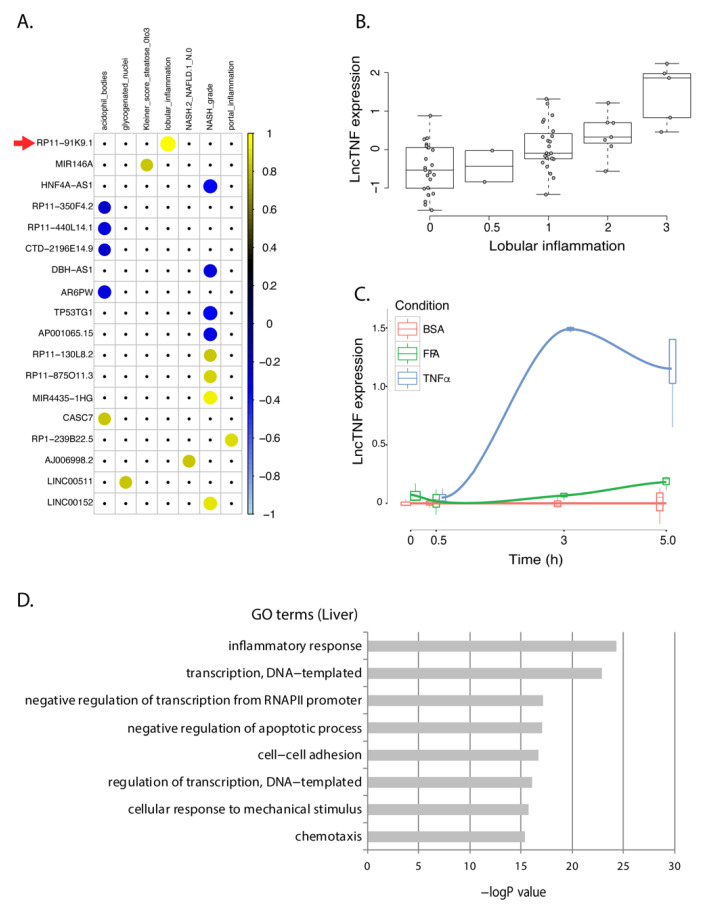
Figure 3.
lncTNF expression in FFA- and TNFα-exposed HepG2 cells and correlation with NASH phenotypes in human livers. (A) Correlation plot representing the correlation coefficients (Spearman) between 18 NASH-associated lncRNAs that showed the same direction of dysregulation in the HepG2 model of NASH. Positive correlations are shown in yellow. Negative correlations are shown in blue. LncTNF, corresponding to RP11-91KP.1, is marked with a red arrow. Rows represent genes and columns represent NASH phenotypes. (B) Correlation between normalized lncTNF expression (y-axis) and NASH grade (x-axis) in human liver samples. (C) Normalized lncTNF expression (y-axis) in HepG2 cells upon exposure to free fatty acids (FFA, green line), tumor necrosis factor alpha (TNFα, blue line), or control conditions (BSA: bovine serum albumin, red line). Mean values for three replicates are shown. x-axis represents exposure time in hours. (D) Gene ontology (GO) terms (y-axis) and FDR corrected p-value (x-axis) as defined by DAVID. Genes co-expressed with lncTNF from the human liver data (FDR < 0.05) were used as input for this analysis.

