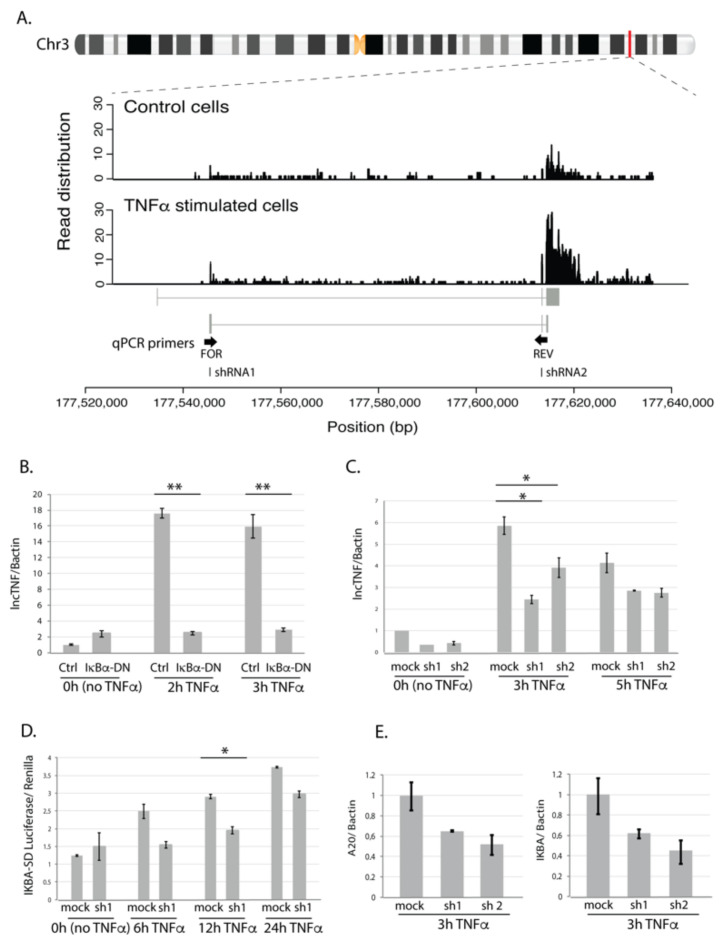
Figure 4.
LncTNF structure and function. (A) Chromosomal location of lncTNF and read distribution based on the RNA sequencing in control (BSA-treated, all time points) and TNFα-stimulated cells (all time points). qPCR primers are located in exon 1 (forward primer) and exon 2 (reverse primer). shRNAs used for knock-down experiments are located in exon 1 (shRNA1) and exon 2 (shRNA2). (B) Gene expression of lncTNF relative to the Bactin (y-axis) measured by qPCR in HepG2 cells transduced with adenovirus containing IκBα dominant negative construct (Ad5IκB; IκBα-DN) and cells transfected with Cre adenovirus used as control (x-axis). Three time points were analyzed (0 h or no stimulation, 3 h, and 5 h of TNFα stimulation). (C) Gene expression of lncTNF relative to Bactin (y-axis) upon lncTNF knock-down using two different shRNAs (shRNA1 and 2) and three time points (x-axis). Scrambled shRNA sequence was used as control (mock). (D) Activity of NF-κB measured by luciferase/renilla ratio (y-axis) in lncTNF-KD cells (shRNA1) compared to mock control cells (x-axis). Transfected cells were stimulated with TNFα for 6, 12, and 24 h or not stimulated (0 h). (E) Gene expression level of A20 and IKBA relative to Bactin (y-axis) in lncTNF-KD cells and mock control cells upon 3 h TNFα stimulation. Values represent mean ± SEM, * = p ≤ 0.05, ** = p < 0.01.

