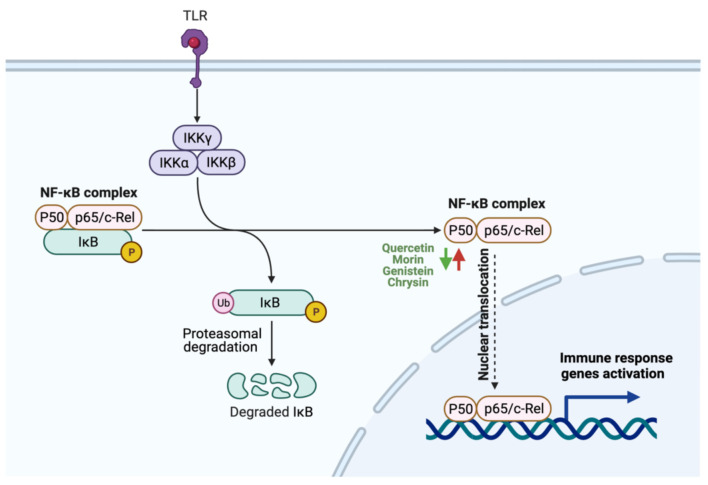
Figure 5.
Schematic illustration of the impact of flavonoids on inflammation. The figure illustrates NF-κB complex activation. Red arrows represent the effects of GI cancer on the pathway, while the green arrows for flavonoids effect. Adapted from “NF-κB signaling pathway”, by BioRender.com (accessed on 3 August 2021).

