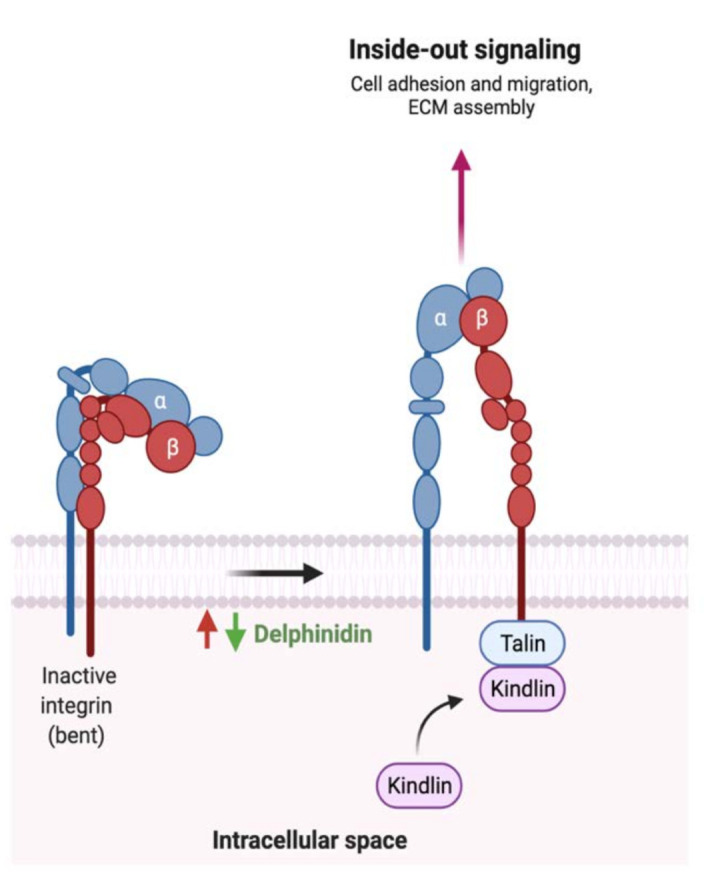
Figure 8.

Schematic illustration of the impact of flavonoids on integrin activation. Red arrows represent the effects of GI cancer on the pathway, while the green arrows illustrate the impact of flavonoids on the pathway. Adapted from “Outside-in and Inside-out Integrin Signaling Pathways”, by BioRender.com (accessed on 3 August 2021).
