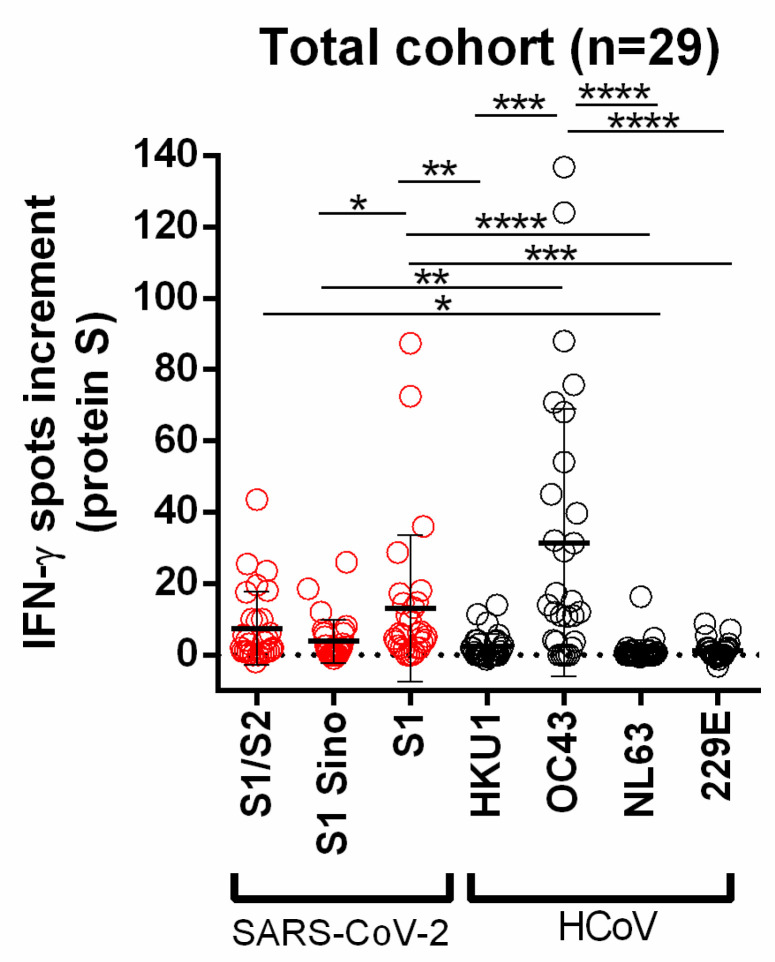
Figure 2.
Distribution of SARS-CoV-2- and HCoV-specific ELISpot responses in all volunteers. Red circles indicate IFN-γ spots increment upon stimulation with S1/S2 peptide mix, S1 Sino, and S1 peptide mix of SARS-CoV-2. Gray circles indicate IFN-γ spots increment upon stimulation with S1 proteins of HCoV-HKU1, HCoV-OC43, HCoV-NL63, and HCoV-229E. Responses were compared by 1-way ANOVA (Friedman test) with Dunn’s correction (* p < 0.05, ** p < 0.01, *** p < 0.001, **** p < 0.0001). Horizontal lines indicate mean values, error bars indicate the standard deviation. The dotted line represents the zero line.

