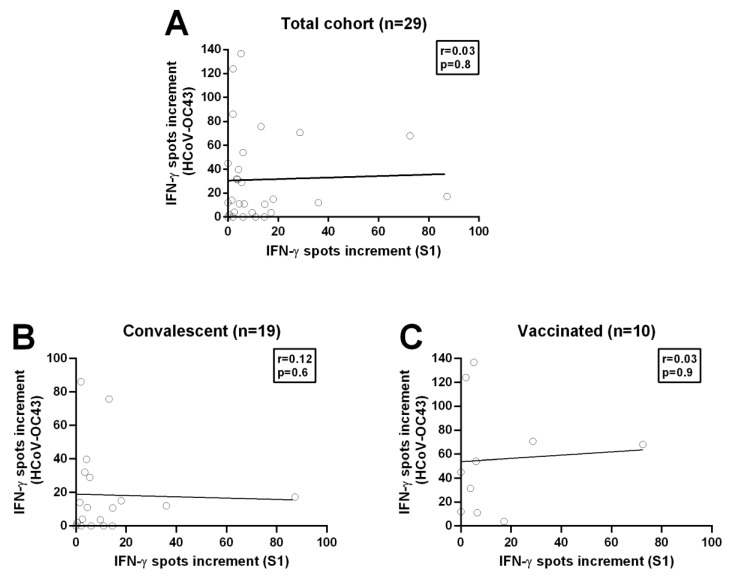
Figure 4.
Spearman correlation analysis on T cell immunity towards SARS-CoV-2 and HCoV-OC43. (A) Spearman correlation between T cell immunity against the S1/S2 peptide mix of SARS-CoV-2 and the N-terminus of the S1 protein of HCoV-OC43 in the total cohort (n = 29). (B) Spearman correlation between T cell immunity against the S1/S2 peptide mix of SARS-CoV-2 and the N-terminus of the S protein of HCoV-OC43 in potential convalescent plasma donors (n = 19). Please note that the scale is different. (C) Spearman correlation between T cell immunity against the S1/S2 peptide mix of SARS-CoV-2 and the N-terminus from the S protein of HCoV-OC43 in completely vaccinated volunteers (n = 10). The figure is representative of all Spearman correlation analyses performed. The black line indicates the regression line.

