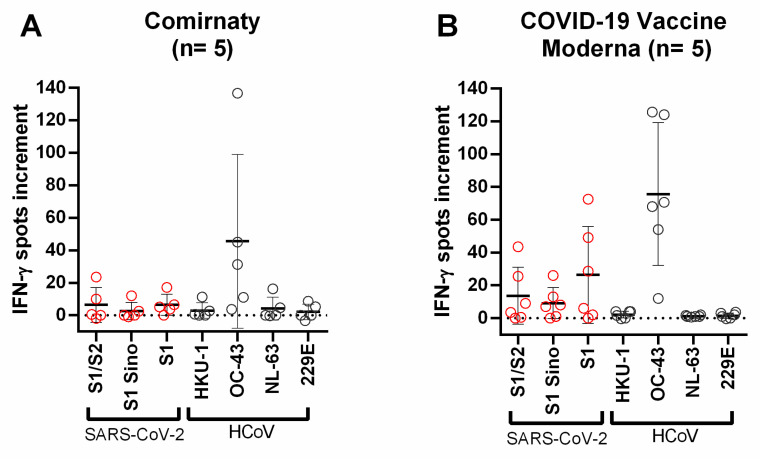
Figure 6.
Distribution of SARS-CoV-2- and HCoV-specific ELISpot responses in vaccinated volunteers. (A) Distribution of ELISpot responses upon stimulation with different S proteins in volunteers vaccinated with Comirnaty (n = 5). (B) Distribution of ELISpot responses upon stimulation with different S proteins in volunteers vaccinated with Moderna COVID-19 vaccine (n = 5). Red circles indicate IFN-γ spots increment upon stimulation with S1/S2 peptide mix, S1 Sino, and S1 peptide mix of SARS-CoV-2. Gray circles indicate IFN-γ spots increment upon stimulation with S1 proteins of HCoV-HKU1, HCoV-OC43, HCoV-NL63, and HCoV-229E. Responses in the three groups of volunteers were compared by Mann–Whitney test. Horizontal lines indicate mean values, error bars indicate the standard deviation. The dotted line represents the zero line. The black line indicates the regression line.

