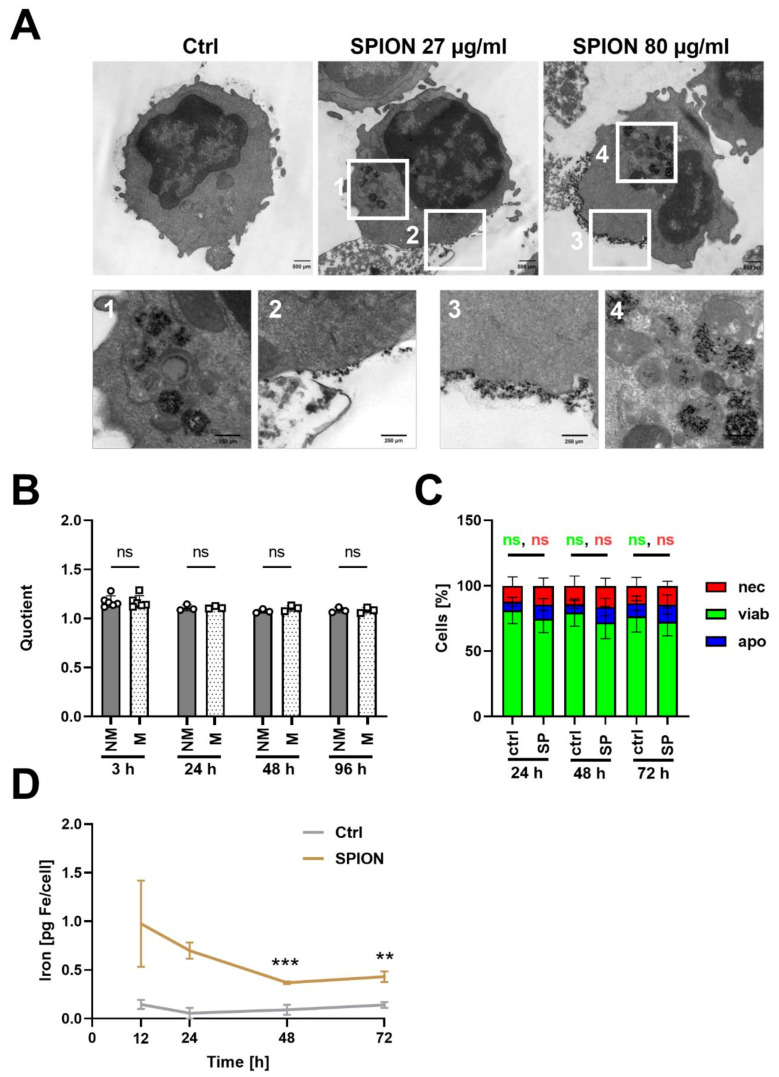
Figure 4.
SPIONs were not exchanged between loaded and non-loaded CD3+ T cells. (A) Subcellular localization of SPIONs determined by TEM. Scale bars depict 500 µm (upper row) and 250 µm (lower row). Squares indicate areas with SPION-loading in T cells. (B) Isolated CD3+ T cells (1 × 10⁶ cells/mL) were loaded with 80 µg Fe/mL SPIONs overnight and stained for CD3 or CTV; non-loaded T cells served as controls. Side scatter values were used for estimation of nanoparticle uptake of SPION-loaded and non-loaded cells. A quotient was calculated by division of the SSC of loaded T cells with that of non-loaded T cells of the same donor at the same time point. (C) Cell viability of SPION-loaded cells. Cells were stained with AxV-FITC and PI. Ax-FITC-/PI- cells were considered viable (viab), Ax-FITC+/PI- apoptotic (apo), and PI+ necrotic (nec). (D) Iron content per cell as determined by atomic emission spectroscopy and division through cell count. Shown are the mean values with standard deviations. Significances were estimated using an unpaired t test with Welch’s correction; ** p ≤ 0.01, *** p ≤ 0.001; ctrl: control, SP: SPIONs, NM: not mixed, M: mixed.

