Figure 5.
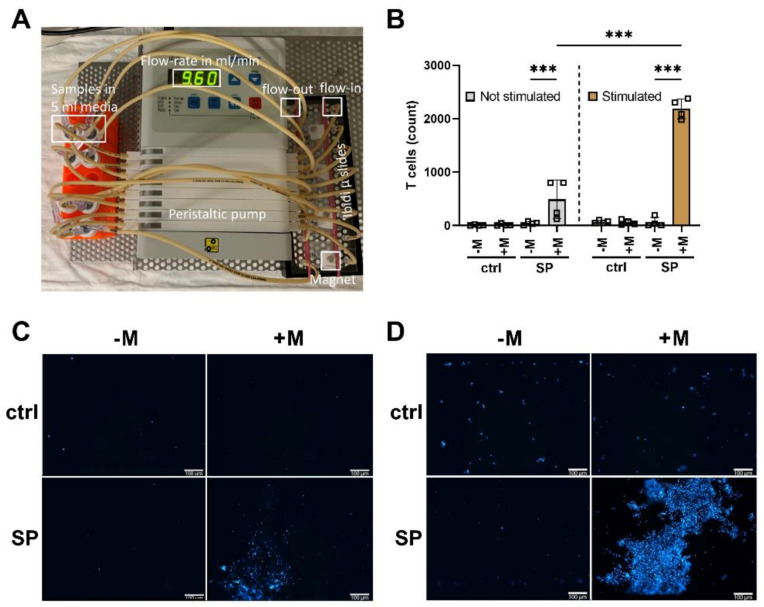
Dynamic magnetic enrichment of T cells. CD3+ T cells were isolated and stimulated for 72 h with a CD3/CD28/CD2 activation mix with 30 IU/mL IL-2. After three days, the T cells received an additional 30 IU/mL IL-2 as well as 80 µg Fe/mL SPIONs for 24 h. T cells without SPIONs or un-stimulated T cells served as controls. Subsequently, the cells were stained with Hoechst 33342. Dynamic enrichment was performed with a peristaltic pump at a flow velocity of 9.6 mL/min for 1 h in µ-slides I Luer. Magnets were added to locally enrich T cells. For the controls, no magnets were added. The slides were then imaged in fluorescent microscopy to analyze cell count. (A) Depiction of the experimental setup. (B) T cell count after the dynamic enrichment and (C,D) corresponding fluorescent microscopy images of the area where the magnet was placed of non-stimulated (C) and stimulated cells (D). Statistical significances were calculated with an unpaired t test with Welch‘s correction; *** p ≤ 0.001. ctrl: control; SP: SPION; -M: without Magnet; +M: with Magnet; the white scale bar indicates 100 µm.

