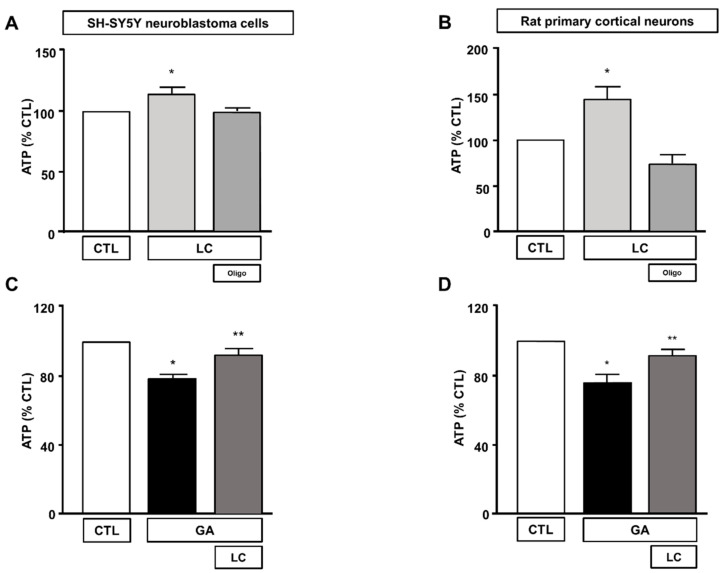
Figure 2.
Effect of LC on intracellular ATP levels in SH-SY5Y neuroblastoma cells and in rat primary cortical neurons. Effect on intracellular ATP levels of 1 h exposure to LC under control conditions in SH-SY5Y neuroblastoma cells (A), and in rat primary cortical neurons (B) in the presence or in the absence of oligomycin (3 µg/mL). Effect of LC on intracellular ATP levels in SH-SY5Y neuroblastoma cells (C) and in rat primary cortical neurons (D) both challenged with GA. Cells were pretreated with LC (3 mM) for 1 h, and then exposed to GA (1 mM) for 24 h (without removing LC). In each experiment, ATP levels were expressed as a percentage of the control. Statistical differences were assessed by one-way ANOVA followed by Dunnett’s post hoc test. (A) F (3, 20) = 5.232. Each column represents the mean ± S.E.M. of n = 6 experiments performed in triplicate. * Significant versus all groups (p < 0.05). (B) F (3, 36) = 14.28. Each column represents the mean ± S.E.M. of n = 10 experiments performed in duplicate. * Significant versus all groups (p < 0.01 versus CTL, p < 0.0001 versus LC+oligo). (C) F (2, 15) = 20.44. Each column represents the mean ± S.E.M. of n = 6 experiments performed in triplicate. * Significant versus all groups (p < 0.0001 versus CTL, p < 0.01 versus LC + GA); ** significant versus GA (p < 0.01). (D) F (2, 18) = 10.36. Each column represents the mean ± S.E.M. of n = 7 experiments performed in triplicate. * Significant versus all groups (p < 0.01 versus CTL, p < 0.05 versus LC + GA); ** significant versus GA and CTL (p < 0.05). Oligo = Oligomycin 3 µg/mL.

