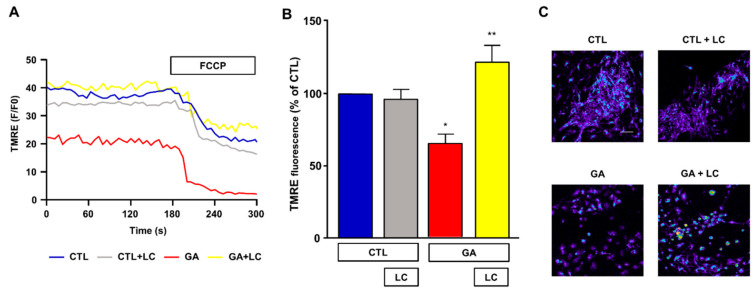
Figure 4.
Analysis of mitochondrial membrane potential in rat primary cortical neurons challenged with GA and exposed to LC. Experiments were performed using a nonquenching concentration (10 nM) of the inner mitochondrial membrane potential indicator TMRE. In each experiment, FCCP (20 µM) was added at the end of the recording session as an internal control. (A) Representative records of mitochondrial membrane potential measurements in rat primary cortical neurons under control conditions (blue line), LC exposure (grey line), 24 h GA challenge (red line) and 24 h GA challenge in the presence of LC (yellow line). (B) Quantitative analysis of the mitochondrial membrane potential under the different experimental conditions. Each column represents the mean ± S.E.M. of 50–100 cells recorded in 4 different sessions (n = 4). In each experiment, TMRE fluorescence was expressed as percentage of the control. Statistical differences were assessed by one-way ANOVA followed by Dunnett’s post hoc test. (C) Representative images of mitochondrial membrane potential measurements. Scale bar 50 μm. (B) F (3, 12) = 9.53. * Significant versus all groups (p < 0.05 versus controls, p < 0.001 versus GA); ** significant versus GA (p < 0.001).

