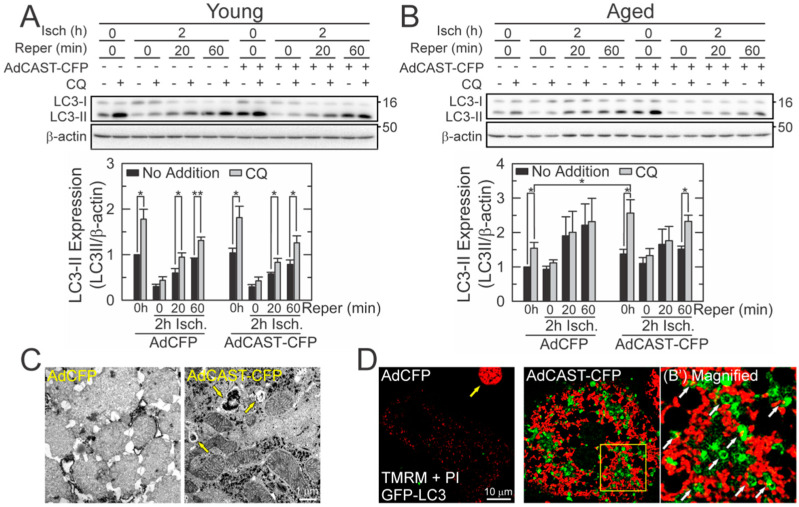
Figure 4.
Restoration of autophagic flux in reperfused aged hepatocytes by CAST overexpression. Autophagic flux after 2 h of ischemia in young (A) and aged (B) hepatocytes with and without CAST overexpression (n = 5). Autophagic flux was measured by IB of LC3-II levels in the presence or absence of 20 µM CQ. Graph represents the quantification of LC3-II relative to its level at normoxia without CQ. (C) TEM images in reperfused aged hepatocytes with and without CAST overexpression. Yellow arrows indicate autophagic vehicles. (D) Representative confocal images of GFP-LC3 and TMRM after 2 h of ischemia followed by 30 min of reperfusion in aged hepatocytes. Yellow and white arrows indicate cell death and the onset of mitophagy, respectively. The right panel is an enlarged image of the square yellow inset in the middle panel. * p < 0.05 and ** p < 0.01.

