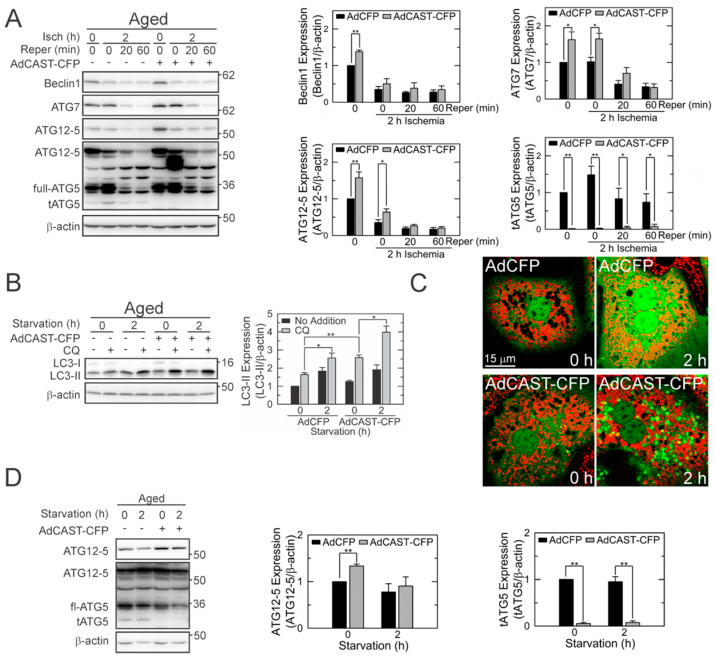
Figure 5.
Suppression of tATG5 formation in reperfused aged hepatocytes by CAST overexpression. (A) IB analysis of ATGs during I/R of aged hepatocytes (n = 4). Graph represents the quantification of ATGs relative to their levels at normoxia without CAST overexpression. (B) Effects of CAST overexpression on autophagy induction under starvation conditions (n = 4). Changes in LC3-II were expressed relative to its level at 0 h without CAST overexpression. (C) Confocal images of GFP-LC3 and TMRM in aged hepatocytes after 2 h of starvation with (bottom panels) and without CAST overexpression (top panels). (D) IB analysis of ATGs in aged hepatocytes during 2 h of starvation (n = 3). Changes in individual ATGs were expressed relative to their levels at 0 h without CAST overexpression. * p < 0.05 and ** p < 0.01.

