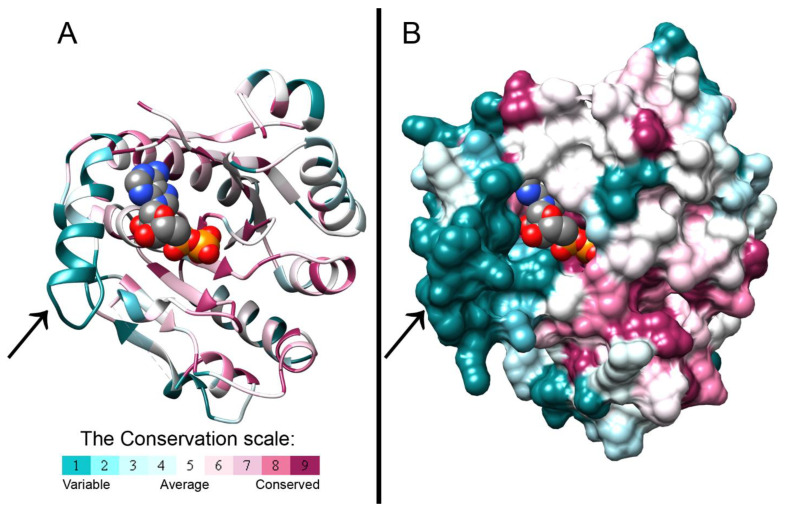
Figure 1.
Evolutionary conservation scores projected on the crystal structure of the BceF kinase domain. The crystal structure of the BceF kinase domain (showing one monomer) is colored by evolutionary conservation scores calculated using the ConSurf webserver [21,22,23]; a variable-to-conserved colored scale is indicated. ADP bound at the active site is represented as space-filled atoms and colored by atom-type with carbons in grey, oxygen in red, nitrogen in blue, and sulfur in yellow. BceF is shown either as ribbons to indicate secondary structures (A) or in a solvent-accessible surface representation (B). An evolutionary variable helix (residues 500–511, with the exception of the conserved Gln502) and the following evolutionary variable loop (residues 512–518) close to the active site are indicated with an arrow.

