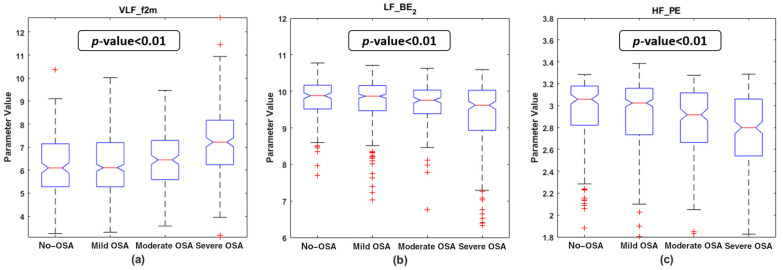
Figure 3.
Boxplot distribution of the features selected in the bispectral classic region feature subset for the four OSA severity groups in the training set. The p-value obtained with the Kruskal–Wallis test is shown in each subplot. (a) VLF_f2m boxplots and p-value; (b) LF_BE2 boxplots and p-value; (c) HF_PE boxplots and p-value.

