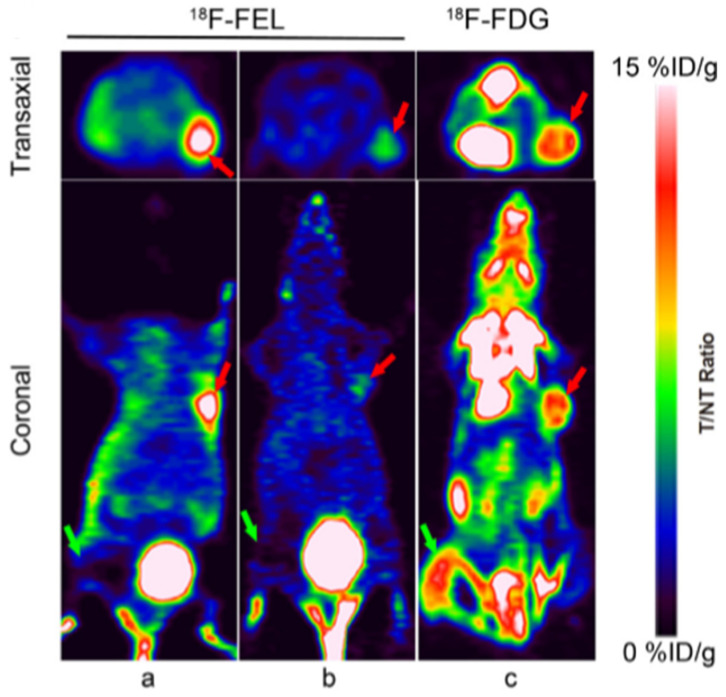
Figure 3.
PET imaging of T3M4 tumors-bearing and inflammation nude mice 60 min after injection of 18F-FEL (a) and 18F-FDG (c). PET images 60 min after co-injection of β-D-lactose as competitor (b). Tumors are marked by red arrows and inflammatory lesions are marked by green arrows. Tumors were delineated 60 min after injection of 18F-FEL, while low background and absence of accumulation was present in inflammatory tissue. Reprinted with permission from Ref [78]. Copyright 2017 Copyright Shaobo Yao, et al.

