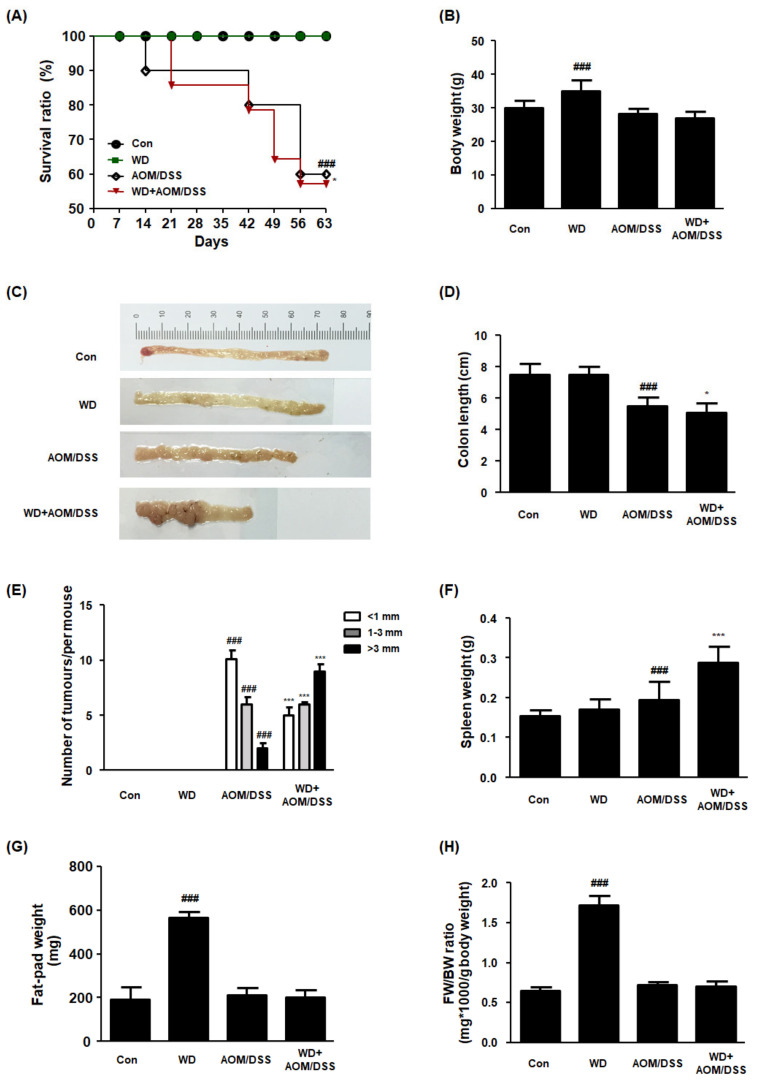
Figure 1.
Effect of WD consumption on the development of CAC in an AOM/DSS-induced CAC mouse model. All mice were allocated to four groups: control mice (Con), Western-diet-fed mice (WD), AOM/DSS-induced CAC mice (AOM/DSS), and AOM/DSS-induced CAC mice fed WD (WD + AOM/DSS). (A) Survival ratio. Data were analyzed by Kaplan–Meier survival analysis (n = 11); (B) body weights for each mouse group; (C) representative photographs of colon tissues from each group; (D) colon lengths; (E) number of macroscopic tumors. The colon length was estimated from the cecum to the proximal rectum. All multiple nodular masses were counted as a tumor in colonic tissues in a blinded manner. (F) Splenic weight; (G) fat-pad weight; (H) FW/BW ratio. FW/BW ratio = fat pad weight in each mouse (mg) × 1000/body weight for each mouse (G). The values are the means ± SD (n = 6); ### p < 0.001 when compared to Con; * p < 0.05 and *** p < 0.001 when compared to AOM/DSS.

