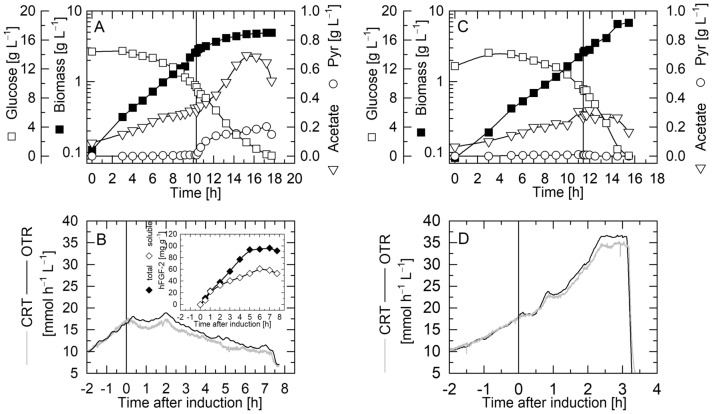
Fig. 1.
Growth inhibition in response to IPTG-induced production of hFGF-2 in batch culture. Time-course data of biomass, glucose, acetate and pyruvate concentrations and respiratory activity, volumetric carbon dioxide and oxygen transfer rates (A, B) during production of hFGF-2 with E. coli TG1:pJHLbFGF and (C, D) in the non-producing control culture with E. coli TG1:pJHLΔ growing under identical conditions. The insert in B depicts the time course of target protein production (total and soluble concentrations of hFGF-2 per biomass). The vertical lines indicate the time point of IPTG addition

