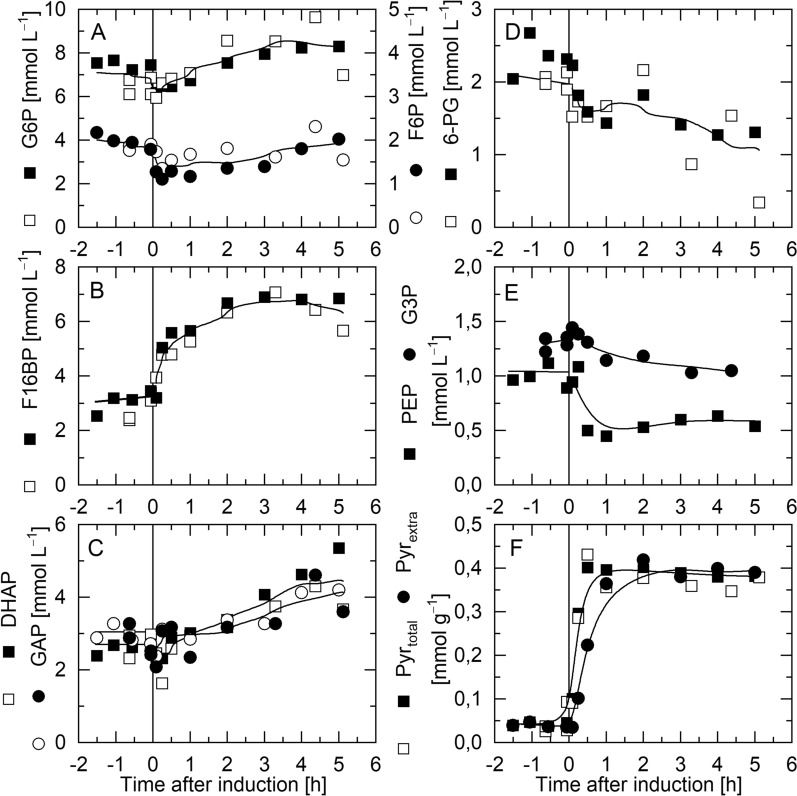
Fig. 3.
Glycolytic pathway intermediates in E. coli TG1:pJHLbFGF during IPTG-induced production of hFGF-2. Time-course data of A glucose-6-phosphate (G6P) and fructose-6-phosphate (F6P), B fructose-1,6-bisphosphate (F16BP), C dihydroxyacetonphosphate (DHAP) and glyceraldehyde-3-phosphate (GAP), D 6-phosphogluconate (6PG, pentose phosphate pathway intermediate), E 3-phosphoglycerate (3PG) and phosphoenolpyruvate (PEP) and F intra- and extracellular pyruvate concentrations. Open and closed symbols correspond to two independent cultivations (trend line serves for better visualization). Please note that the volumetric concentrations given relate to the concentrations in the E. coli cytoplasm. The vertical lines indicate the time point of IPTG addition

