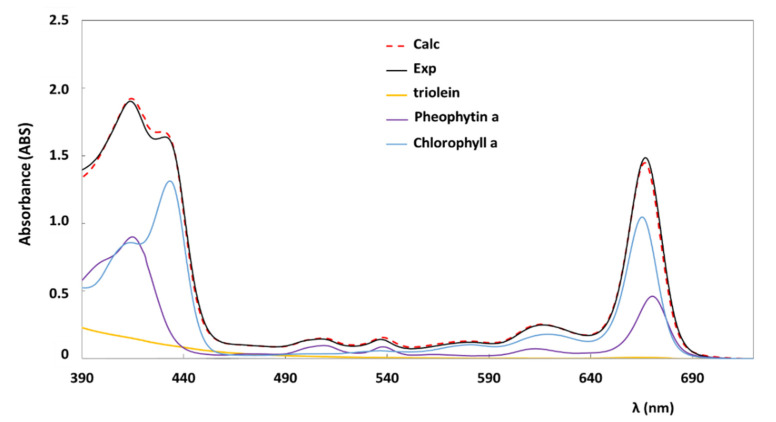
Figure 5.
Experimental (Exp) and theoretical (Calc) UV-vis absorption spectra of the test sample (‘CA_20.5’) at time = 123′ during the pheophytinization process (see Figure 4). Single pigments’ spectra used in the deconvolution are also reported, namely chlorophyll a and pheophytin a. Triolein spectral contribution is also shown. Optical path was 0.5 cm. The value of R2 of the deconvolution was 0.997.

