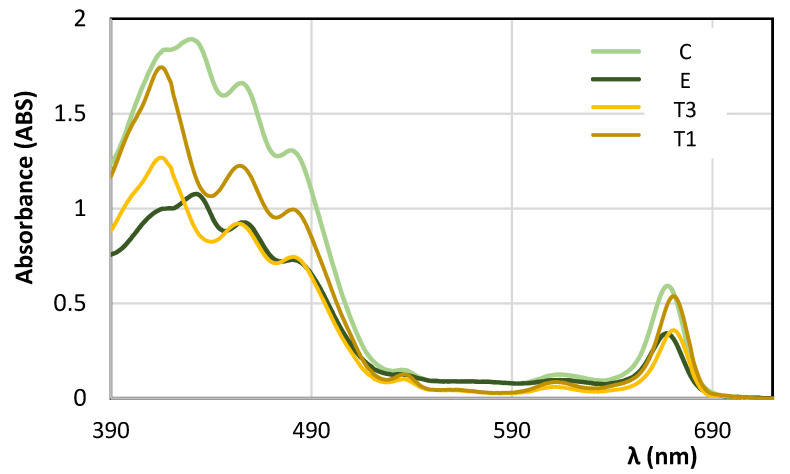
Figure 6.
Experimental near UV-vis spectra of fresh EVOOs (samples C and E) and ‘on-the-shelf’ EVOOs (sample T1 and T3). Spectra were recorded after 30 and 38 days from the oil production in the case of sample C and E, respectively. On-the-shelf EVOOs were analyzed after ~4 months from their production. Spectra were recorded with optical path of 0.5 cm.

