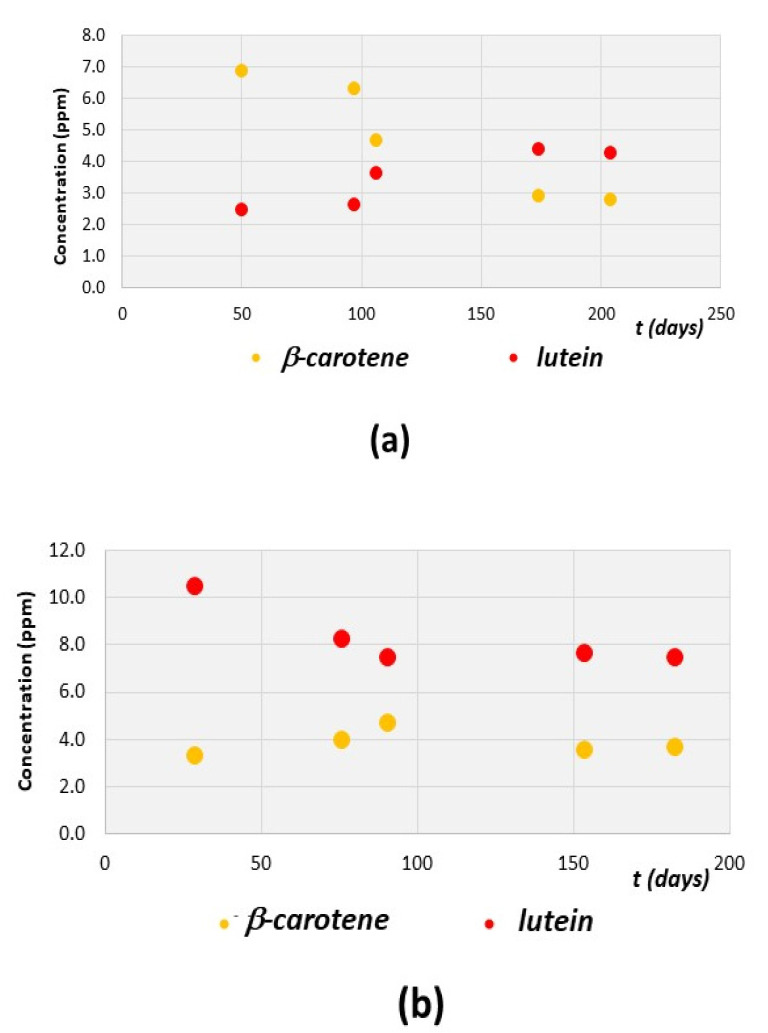
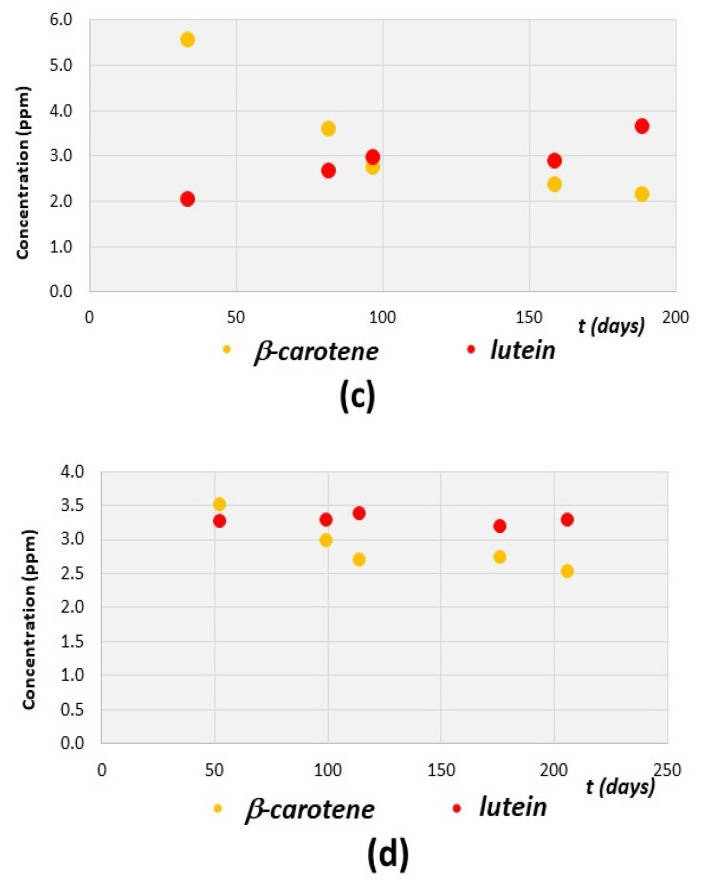
Figure 10.
Trends of the concentration (ppm) of β-carotene (yellow circles) and lutein (red circles) during time (t) expressed in days of several fresh EVOO samples. Data are obtained from the deconvolution of the experimental spectra. Data refer to (a) sample A, (b) sample C, (c) sample D, and (d) sample E.


