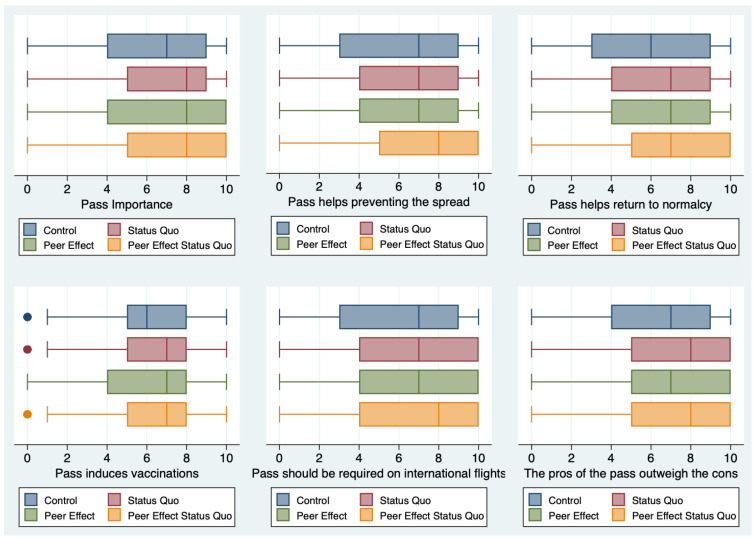
Figure 4.
Summary of results for the statements meant to capture positive attributes of the COVID pass (statements 1–3, 10, 11, and 13). The boxplots show the distribution of responses in the Control, Status Quo, Peer Effect, and Peer Effect + Status Quo groups without any additional control. A higher value corresponds to more favorable attitudes towards the pass.

