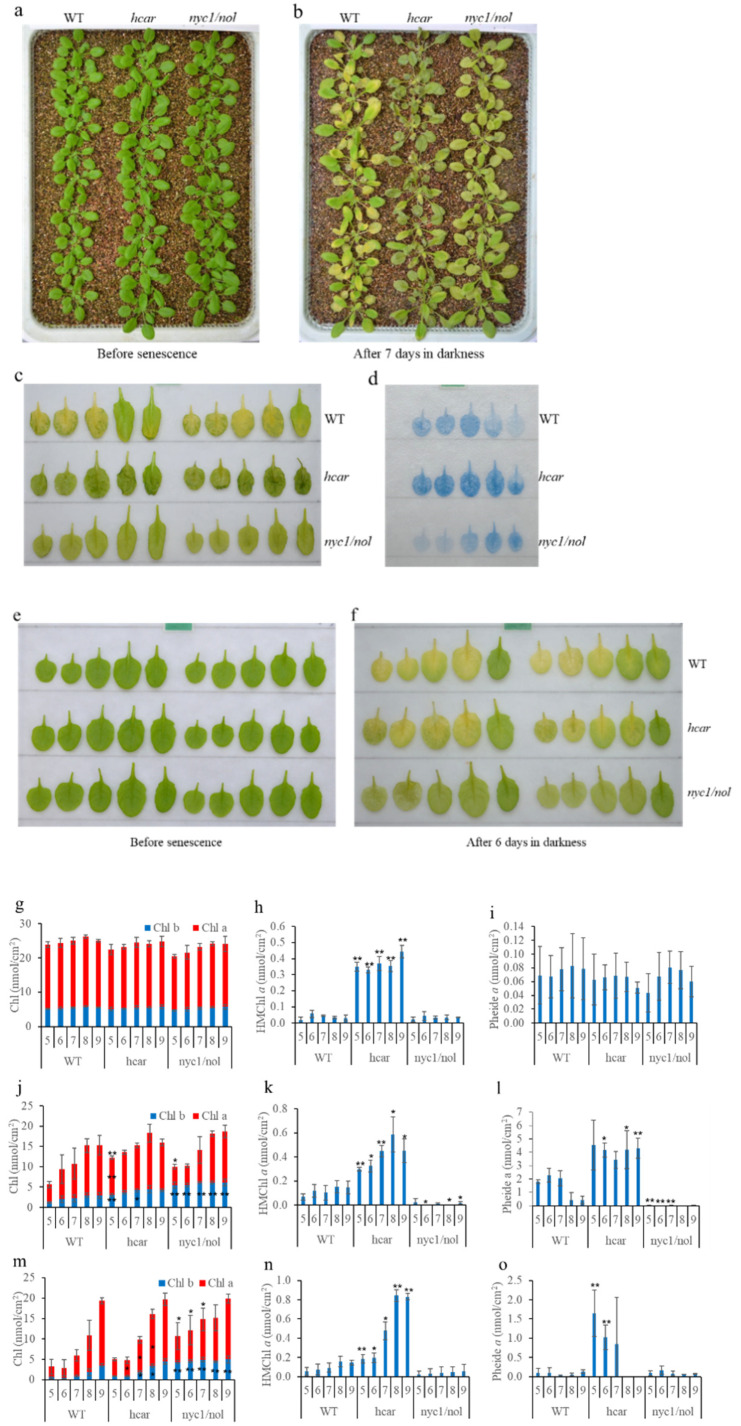
Figure 1.
Phenotypic and Chl metabolic characterization of WT, hcar and nyc1/nol plants during dark-induced senescence. (a,b) Four-week-old WT, hcar, and nyc1/nol plants grown in soil before and after incubation in darkness for seven days. (c) No. 5–9 leaves (leaf numbers are counted from the bottom (oldest) to the top (youngest) of the plants) detached from dark incubated plants. (d) Detached No. 5–9 leaves from dark-induced plants stained with trypan blue. (e,f) Detached leaves from 4-week-old WT, hcar, and nyc1/nol plants before and after incubation in darkness for six days. (g–i), (j–l) and (m–o): Chl, HMChl a, and Pheide a content in No. 5–9 leaves (g–i) before, (j–l) after intact plant, and (m–o) after detached leaf incubation in darkness, respectively. Values are the means ± SD of three independent experiments. Asterisks indicate significant differences compared to the same number of WT leaves in the same condition (Student’s t-test, ** p < 0.01, and * p < 0.05). Asterisks within a blue-colored bar indicate a significant difference of Chl b, while asterisks within a red-colored bar indicate a significant difference of Chl a. Asterisks above bars indicate a significant difference of Chl, HMChl a, or Pheide a.

