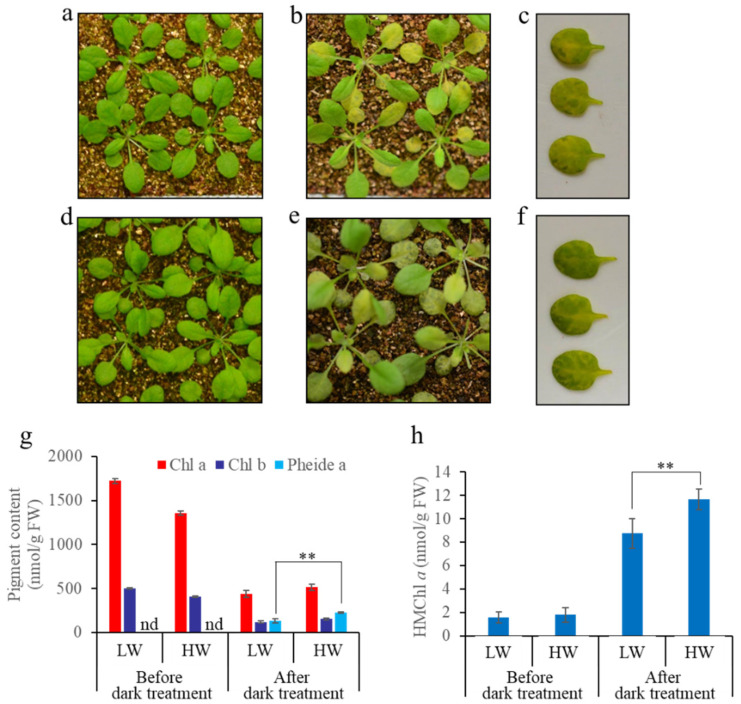
Figure 3.
Phenotypic and Chl metabolic characterization of WT plants grown in soil with different water content during dark-induced senescence. (a–c) The phenotype of WT plants before (a) and after (b,c) 7 days of dark treatment. Plants were grown in soil with a low water content. (c) No. 5–6 leaves were detached from dark-treated WT plants. (d–f) The phenotype of WT plants before (d) and after (e,f) 7 days of dark treatment. Plants were grown in soil with a high water content. (f) No. 5–6 leaves were detached from dark-treated WT plants. (g) Chl and Pheide a contents in No. 5–6 leaves before and after intact plant incubation in darkness. (h) HMChl a content of leaves No. 5–6 before and after intact plant incubation in darkness. Values are the mean ± SD of three independent experiments. LW indicates soil with a low water content (approximately 70% moisture), and HW indicates soil with high water content (saturated moisture). Asterisks indicate significant differences (Student’s t-test, ** p < 0.01). nd indicates that the pigments content was not detected.

