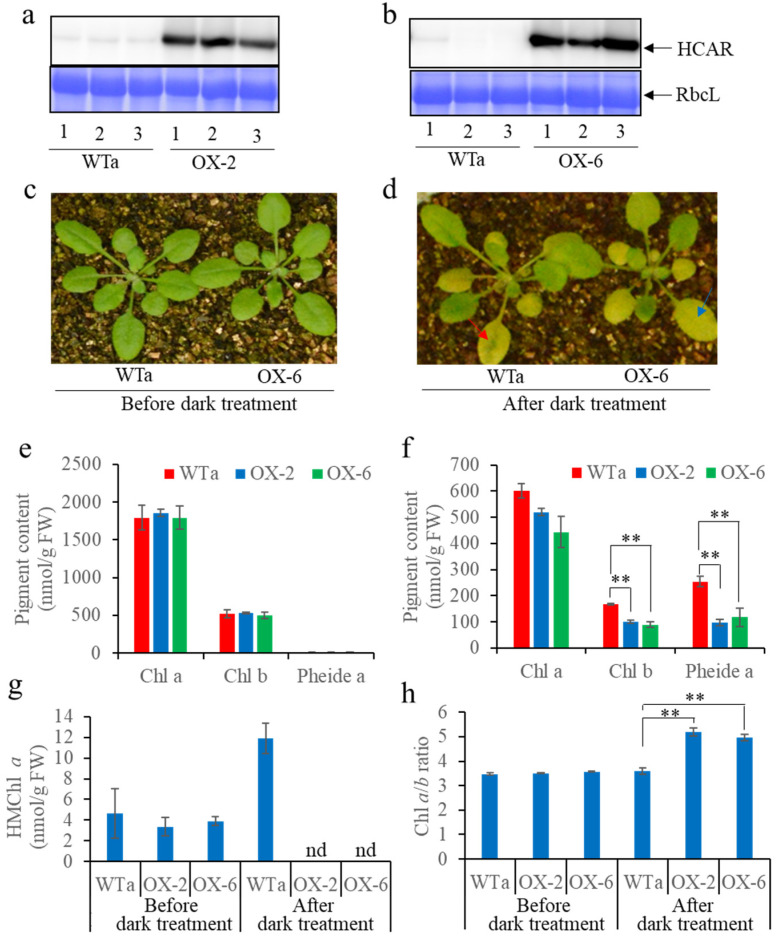
Figure 4.
Phenotypic and Chl metabolic characterization of HCAR-OX and WT plants during dark-induced senescence. (a,b) HCAR protein abundance in WTa and HCAR-OX lines. Total leaf protein was separated by SDS-PAGE and subjected to immunoblot analysis with anti-AtHCAR antiserum. (c,d) Phenotype of HCAR-OX lines and WT plants before and after seven days of dark treatment. Red arrow indicates the “green island” symptoms of WT plants. The blue arrow indicates leaf senescence without “green island” symptoms of the HCAR-OX lines. (e,f) Chl and Pheide a content of No. 5–6 leaves before and after intact plant incubation in darkness. (g,h) HMChl a content and Chl a/b ratio of leaves No. 5–6 before and after intact plant incubation in darkness. Error bars indicate the SDs of three biological replicates. Asterisks indicate significant differences compared to BCG (Student’s t-test, ** p < 0.01). nd indicates the pigments content was not detected.

