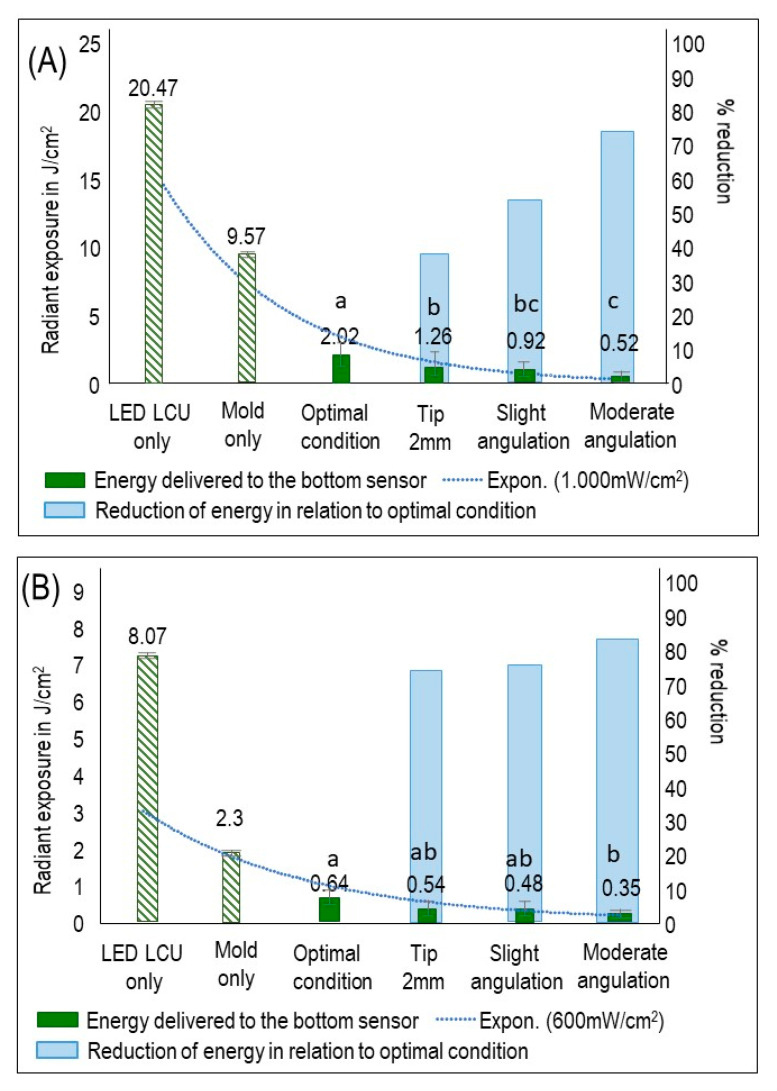
Figure 2.
RE values that reached the sensor and the percentage of RE reduction in the underperformed conditions compared to optimal condition (mean ± sd; n = 6). (A) RE values and the percentage of RE reduction using LCU1000 with an output of 1000 mW/cm2. (B) RE values and the percentage of RE reduction using LCU600 with an output of 600 mW/cm2. On the first y-axis, the barplot demonstrates radiant exposure (RE) expressed in J/cm2. On the second y-axis, the barplot demonstrates the percentage of RE reduction. The dotted line illustrates the reduced RE for all groups concerning RE delivered to the sensor by applying the LCU directly on the sensor. Values with different letters are significantly different from each other (p < 0.05).

