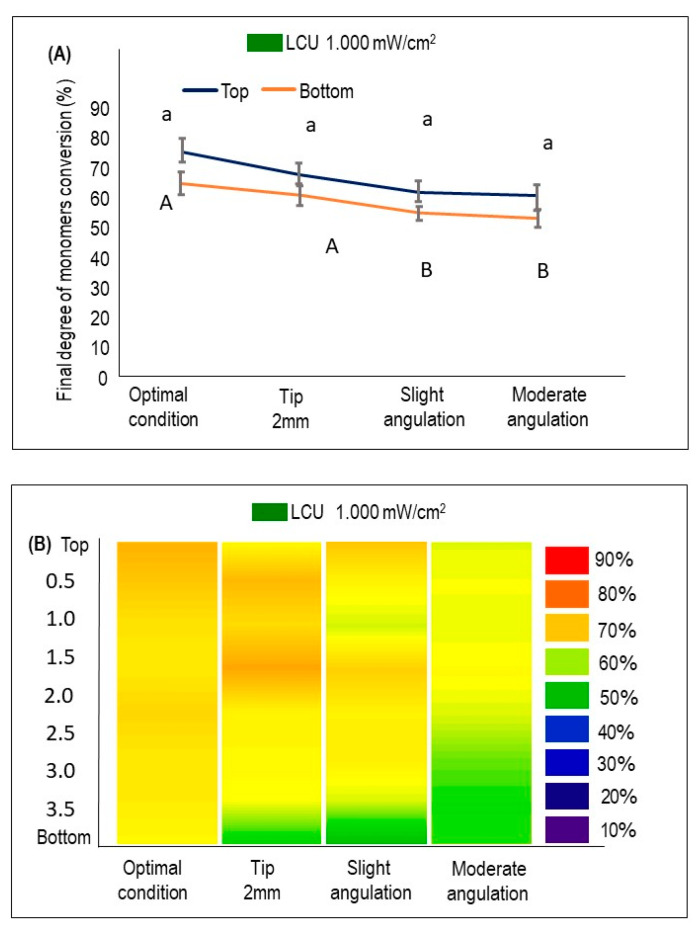
Figure 3.
The %DC using LCU1000 with an output of 1000 mW/cm2 at the top and bottom of BF composites cured optimally or following the underperformed conditions (mean ± sd; n = 3). (A) The %DC values at the top and bottom of each condition. Lower case letters compare the %DC at the top of the specimen, while capital case letters compare the %DC at the bottom. Dissimilar letters are significantly different from each other (p < 0.05). (B) The %DC is measured at different depths from top to bottom and visualized by the heat maps. The color bar (right) illustrates the visual representation of the %DC corresponding to the colors seen.

