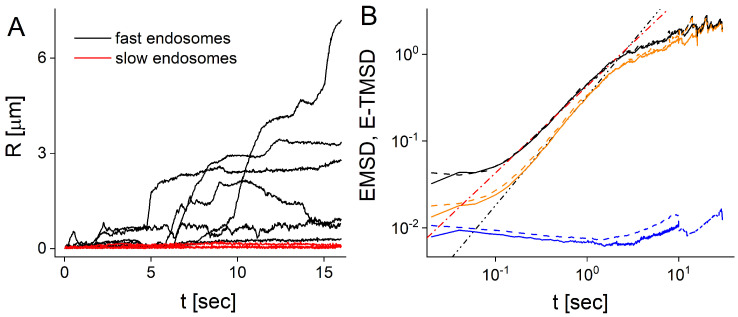
Figure 1.
Endosomes are split into slow and fast moving: (A) Distance traveled by fast (black curves) and slow (red curves) endosomes (nine sample experimental trajectories are shown). Most experimental trajectories possess active motion visible as a rapid increase or decrease of R; (B) EMSDs (solid curves) and E-TMSDs (dashed curves) of fast (black curves) and slow (blue curves) endosomes compared with EMSD and E-TMSD of all trajectories (orange curves). The dashed-dotted and dashed-double-dotted lines represent and t functions.

