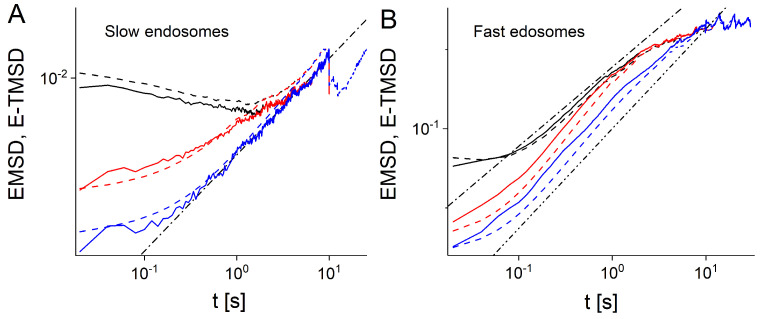
Figure 2.
EMSDs and E-TMSDs (solid and dashed curves) of experimental trajectories of slow (A) and fast moving endosomes (B). Black curves correspond to s. Red and blue curves represent EMSDs and E-TMSDs of experimental trajectories which have duration longer than 2 and 8 s, respectively. The dashed-dotted line in (A) represents the function . In (B), the dashed-dotted line and the dashed-double-dotted line represent the linear, t, and super-linear, , functions, respectively.

