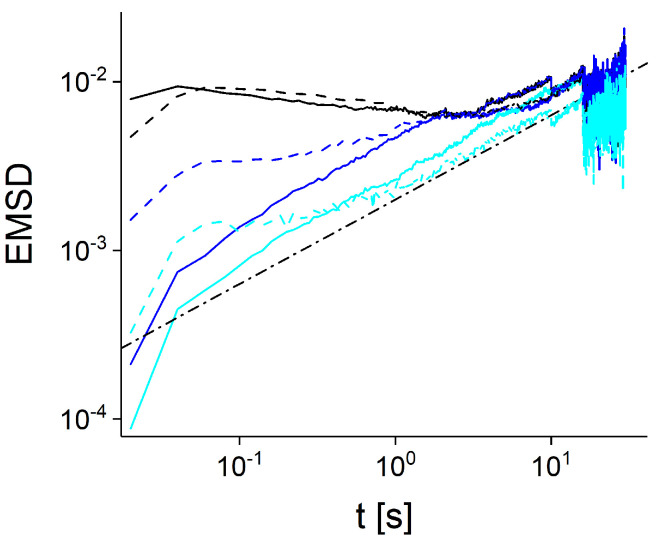
Figure 4.
EMSDs calculated for simulated hFBM trajectories (solid lines) as a function of time interval. Black curves correspond to EMSDs of all trajectories of slow endosomes and hFBM, blue curves are EMSDs of trajectories longer than s and cyan curves are EMSDs of trajectories longer than s. The subdiffusive behavior with the anomalous exponent is shown as the dashed-dotted line. The EMSDs of slow experimental endosomal trajectories are shown for comparison (dashed lines). Notice that hFBM trajectories were simulated without external noise (measurement error), which led to discrepancy between simulated and experimental EMSDs at small time scale.

